Simple Log Service provides the CloudLens for SLS application to monitor and manage assets such as projects and Logstores. This way, you can manage the assets and obtain information about asset consumption in a more efficient manner. This topic describes how to use CloudLens for SLS to monitor Simple Log Service.
Background information
After you enable CloudLens for SLS, Simple Log Service automatically collects global logs and operational logs. Global logs include audit logs, error logs, and metrics. Operational logs include the important logs and job operational logs of original instance logs. You are not charged for the logs.
If this is your first time to enable CloudLens for SLS, the project named
log-service-{Alibaba Cloud account ID}-{region}is used to store global logs. The{region}variable specifies the region that you select to store global logs when you enable CloudLens for SLS. The project namedlog-service-{Alibaba Cloud account ID}-{region}is used to store operational logs. The{region}variable specifies the region where the project resides. For more information about supportedregions, see Usage notes.ImportantIf you delete the project in which operational logs are stored, a project is automatically created.
If you enabled CloudLens for SLS, the configured region and project are used by default.
In the following example, CloudLens for SLS is used to monitor whether project quotas are exceeded. For more information, see Usage notes of CloudLens for SLS.
Step 1: Enable CloudLens for SLS
- Log on to the Log Service console.
In the Log Application section, click the Cloud Service Lens tab. Then, click CloudLens for SLS.
On the Data Import Management page, click the SLS Collection Policies tab. Then, follow the on-screen instructions to enable the log collection feature. When you enable the log collection feature, Simple Log Service automatically authorizes CloudLens for SLS to assume the
AliyunServiceRoleForSLSAuditservice-linked role to collect global logs and operational logs. For more information, see Manage the AliyunServiceRoleForSLSAudit service-linked role.
Step 2: View monitoring data
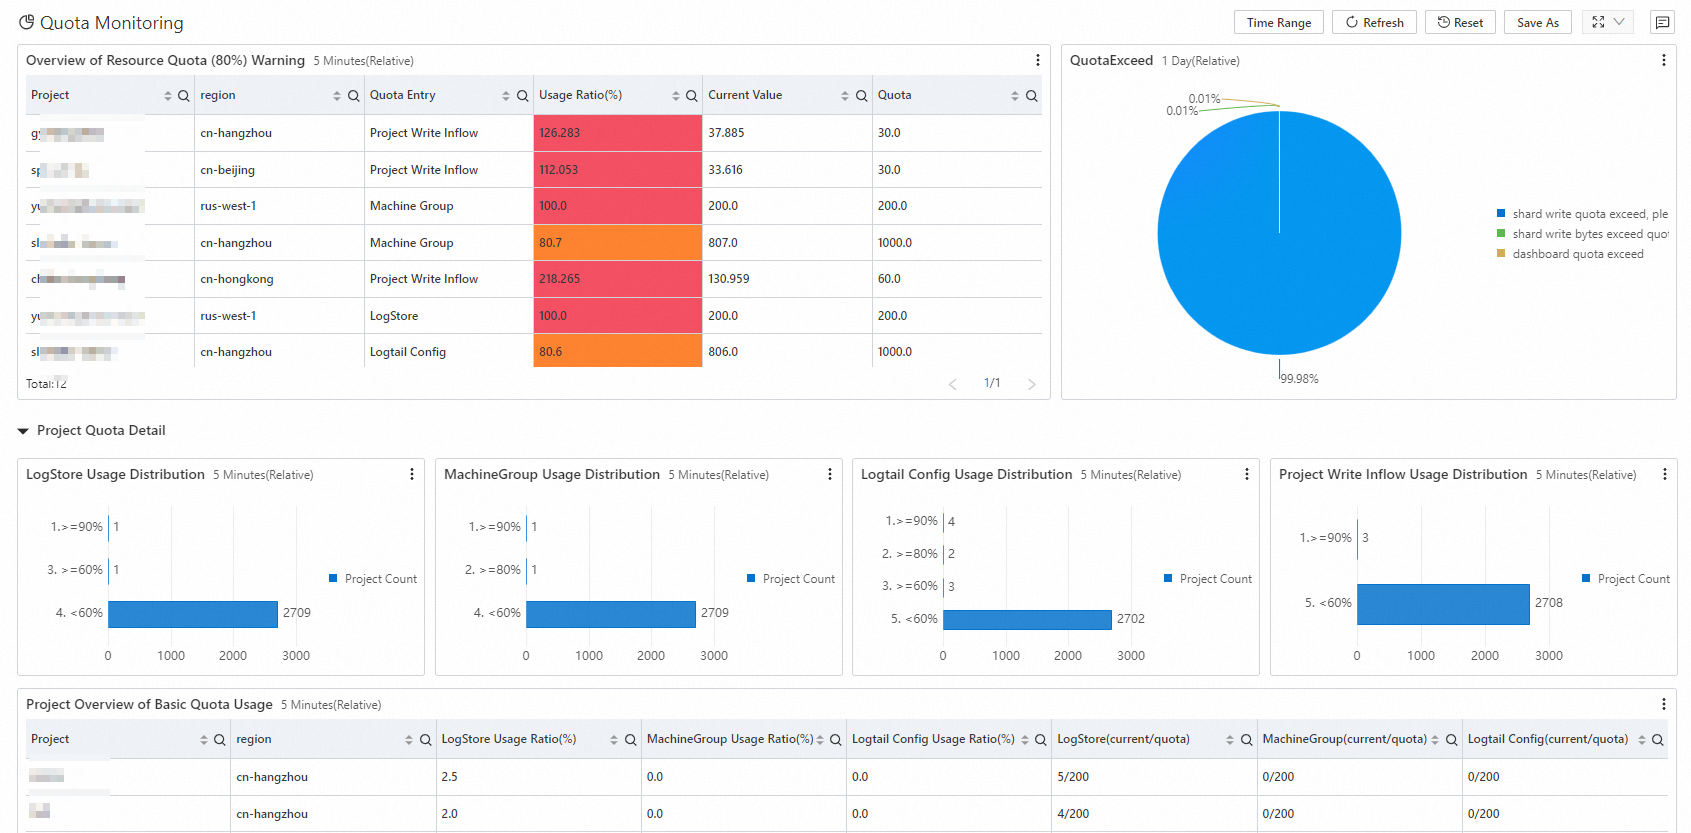
After you enable log collection, Simple Log Service automatically generates a dashboard for the collected logs. You can check whether project quotas are exceeded on the Quota Monitoring dashboard.
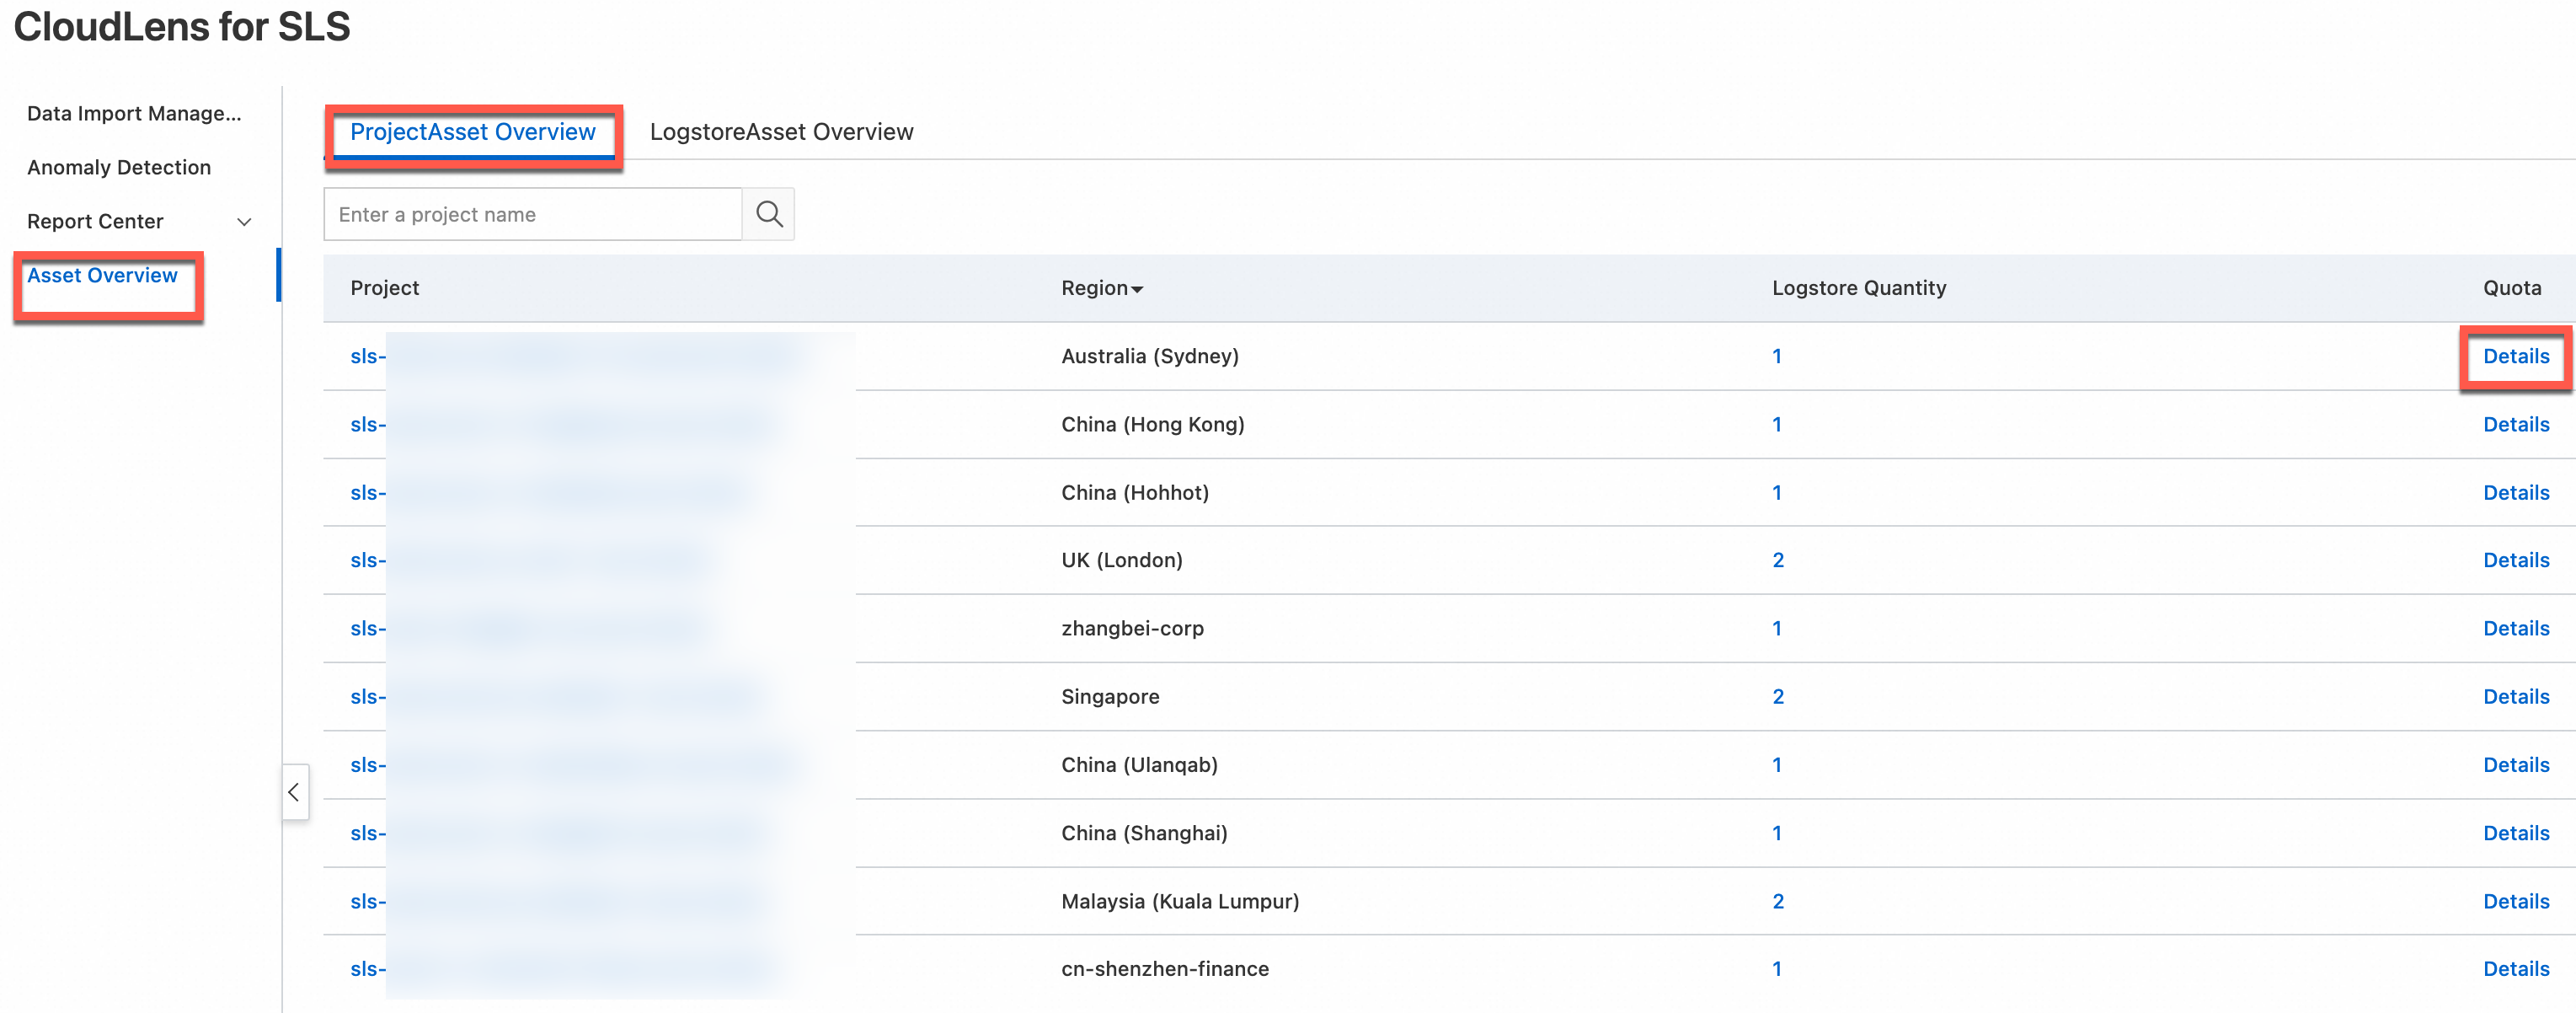
In the left-side navigation pane, choose Asset Overview.
On the Project Asset Overview tab, click Details for the project that you want to manage. Adjust the resource quotas. For more information, see Adjust resource quotas.
In the left-side navigation pane, choose .
View the usage of project quotas. Project quotas include the Logstore quota, dashboard quota, shard quota, alert quota, machine group quota, and Logtail configuration quota.