CloudLens for SLS is an application that provides centralized monitoring and management for your Simple Log Service (SLS) assets. It helps you improve management efficiency and gain a clear understanding of your resource consumption.
Features
CloudLens for SLS supports the following features.
Centralized asset management for all projects and logstores that meet specific conditions within your Alibaba Cloud account. For more information about the conditions, see Supported regions.
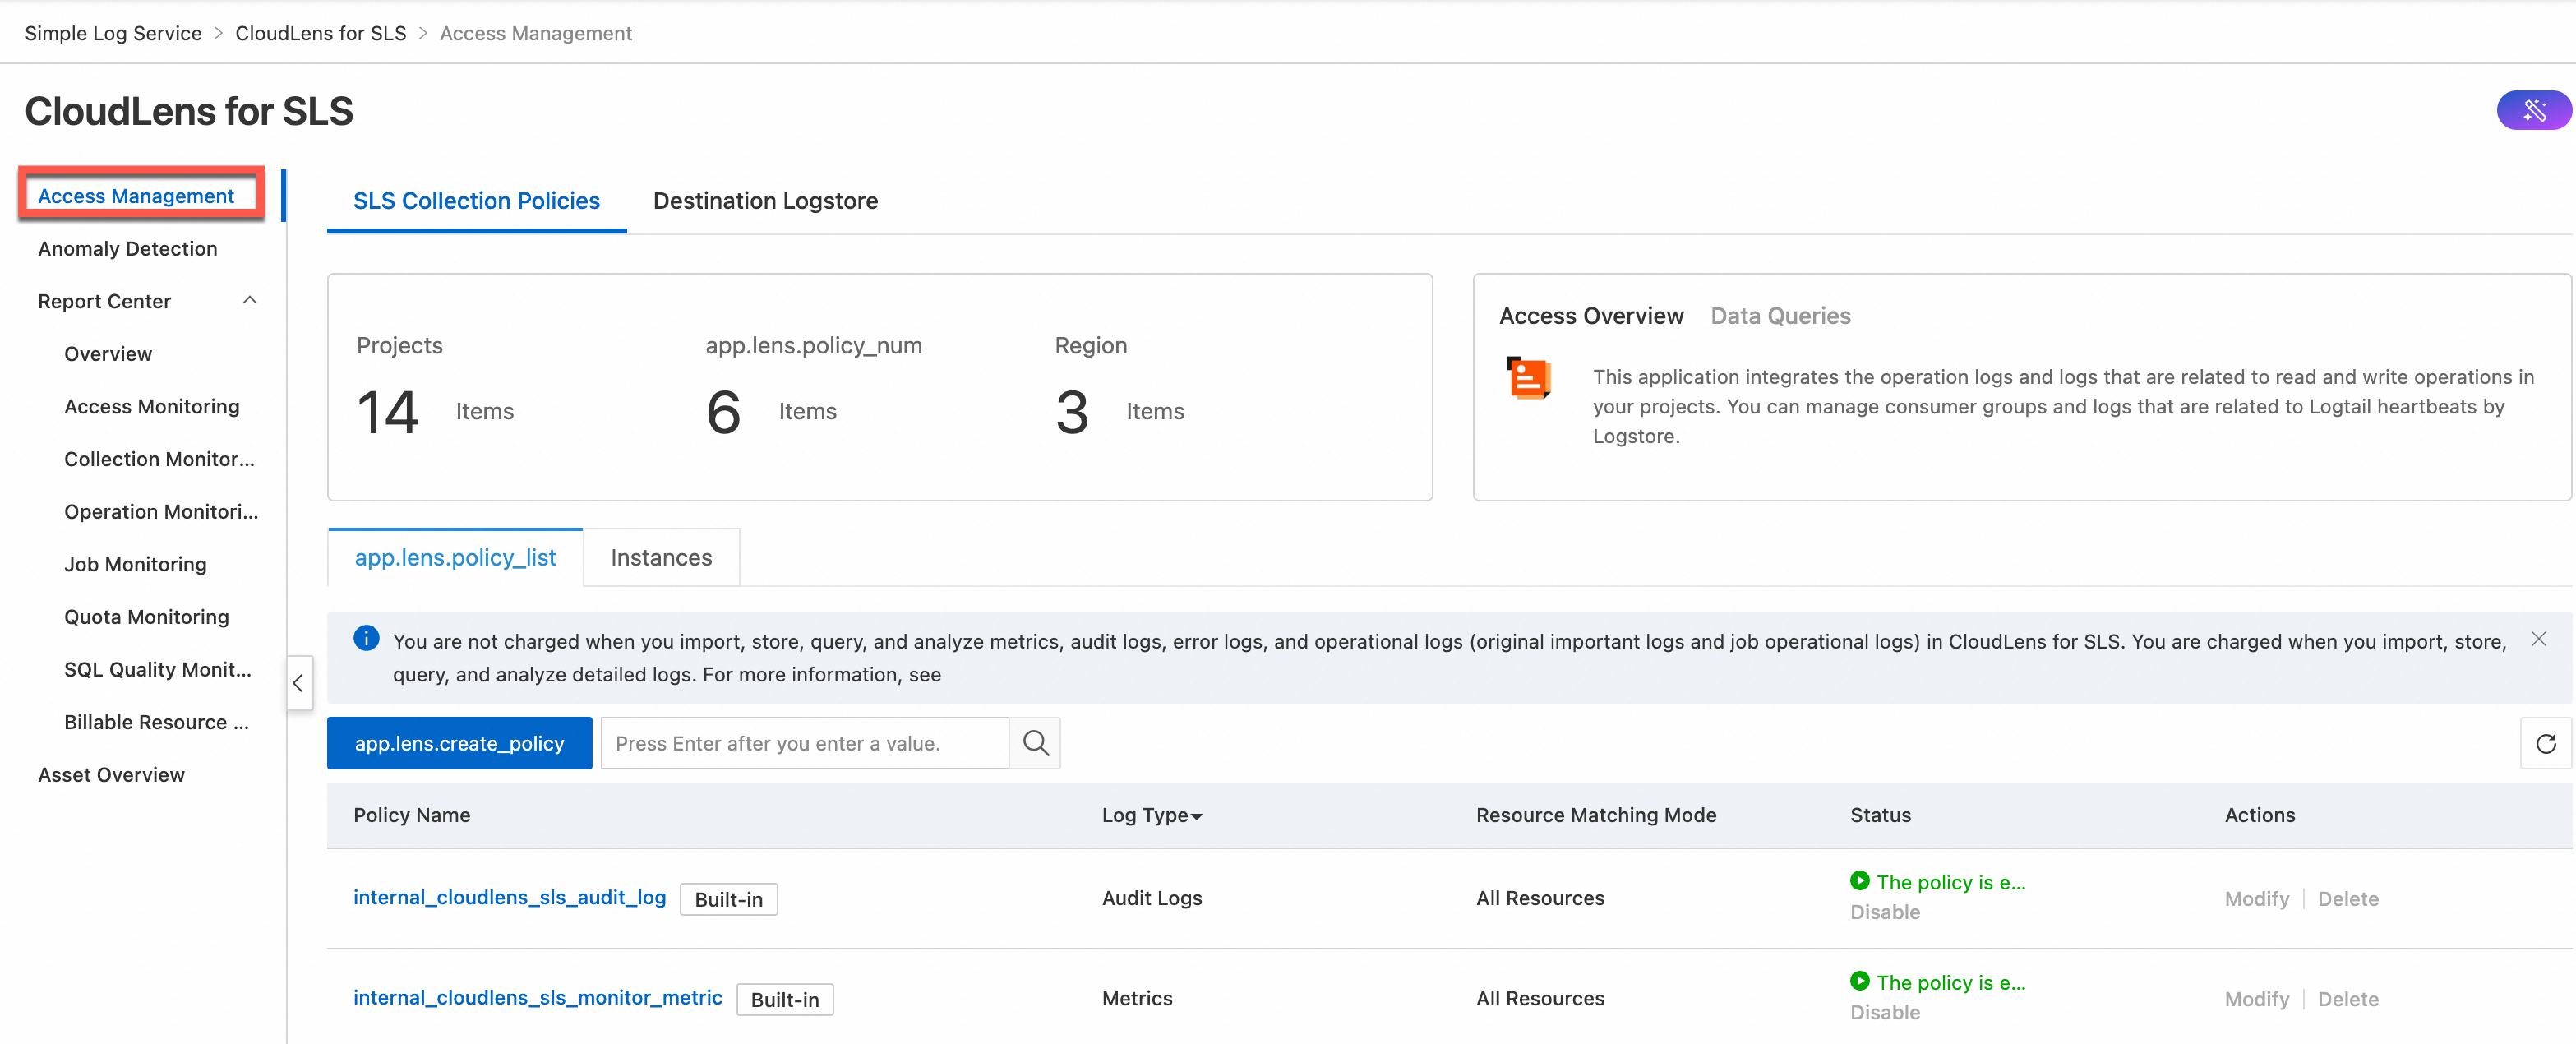
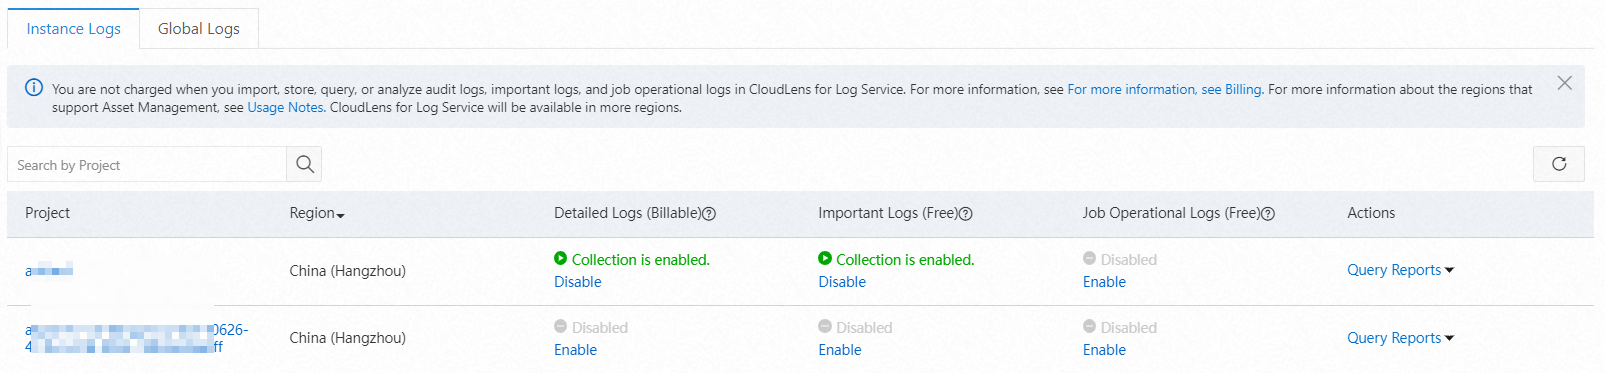
One-click log collection for instance logs and global logs. Instance logs are classified into important logs, detailed logs, and job operational logs. Global logs are classified into audit logs, billing logs, error logs, and metrics.
NoteYou can view only instance logs and global logs that are generated after you enable the log collection feature.
Important logs record the consumption delay of consumer groups for each logstore. Important logs also record the errors, heartbeats, and statistics of Logtail. The logs are stored in a logstore named internal-diagnostic_log of a specified project.
Detailed logs record the operations that create, modify, update, and delete resources in a project. Detailed logs also record data read and write operations. The logs are stored in a logstore named internal-operation_log of a specified project.
Job operational logs record the error and latency information about jobs such as data import jobs of the new version, data shipping jobs of the new version, and Scheduled SQL jobs. The logs are stored in a logstore named internal-diagnostic_log of a specified project.
Audit logs record the operations to create, modify, update, and delete resources in all projects within the current Alibaba Cloud account. The logs are stored in a logstore named internal-audit_log of a specified project.
Billing logs record billable resource data. The logs are generated by Cost Manager, stored in Tablestore (OTS), and automatically updated on a daily basis. For more information about the data, see Description of billing data.
NoteThe first time you enable the log collection feature for billing logs, the feature takes approximately 1 to 2 hours to import logs. The import duration depends on the volume of billing data.
Only Alibaba Cloud public cloud users can enable log collection for billing logs.
After you enable the log collection feature for billing logs, you cannot disable the feature.
Error logs record the errors of the operations that create, modify, update, and delete resources and the errors of data read and write operations in all projects within your Alibaba Cloud account. The logs are stored in a logstore named internal-error_log of a specified project.
Metrics record the traffic, requests, and latency of each project and each logstore. The metrics are stored in a Metricstore named internal-monitor-metric of a specified project.
For more information, see Service logs.
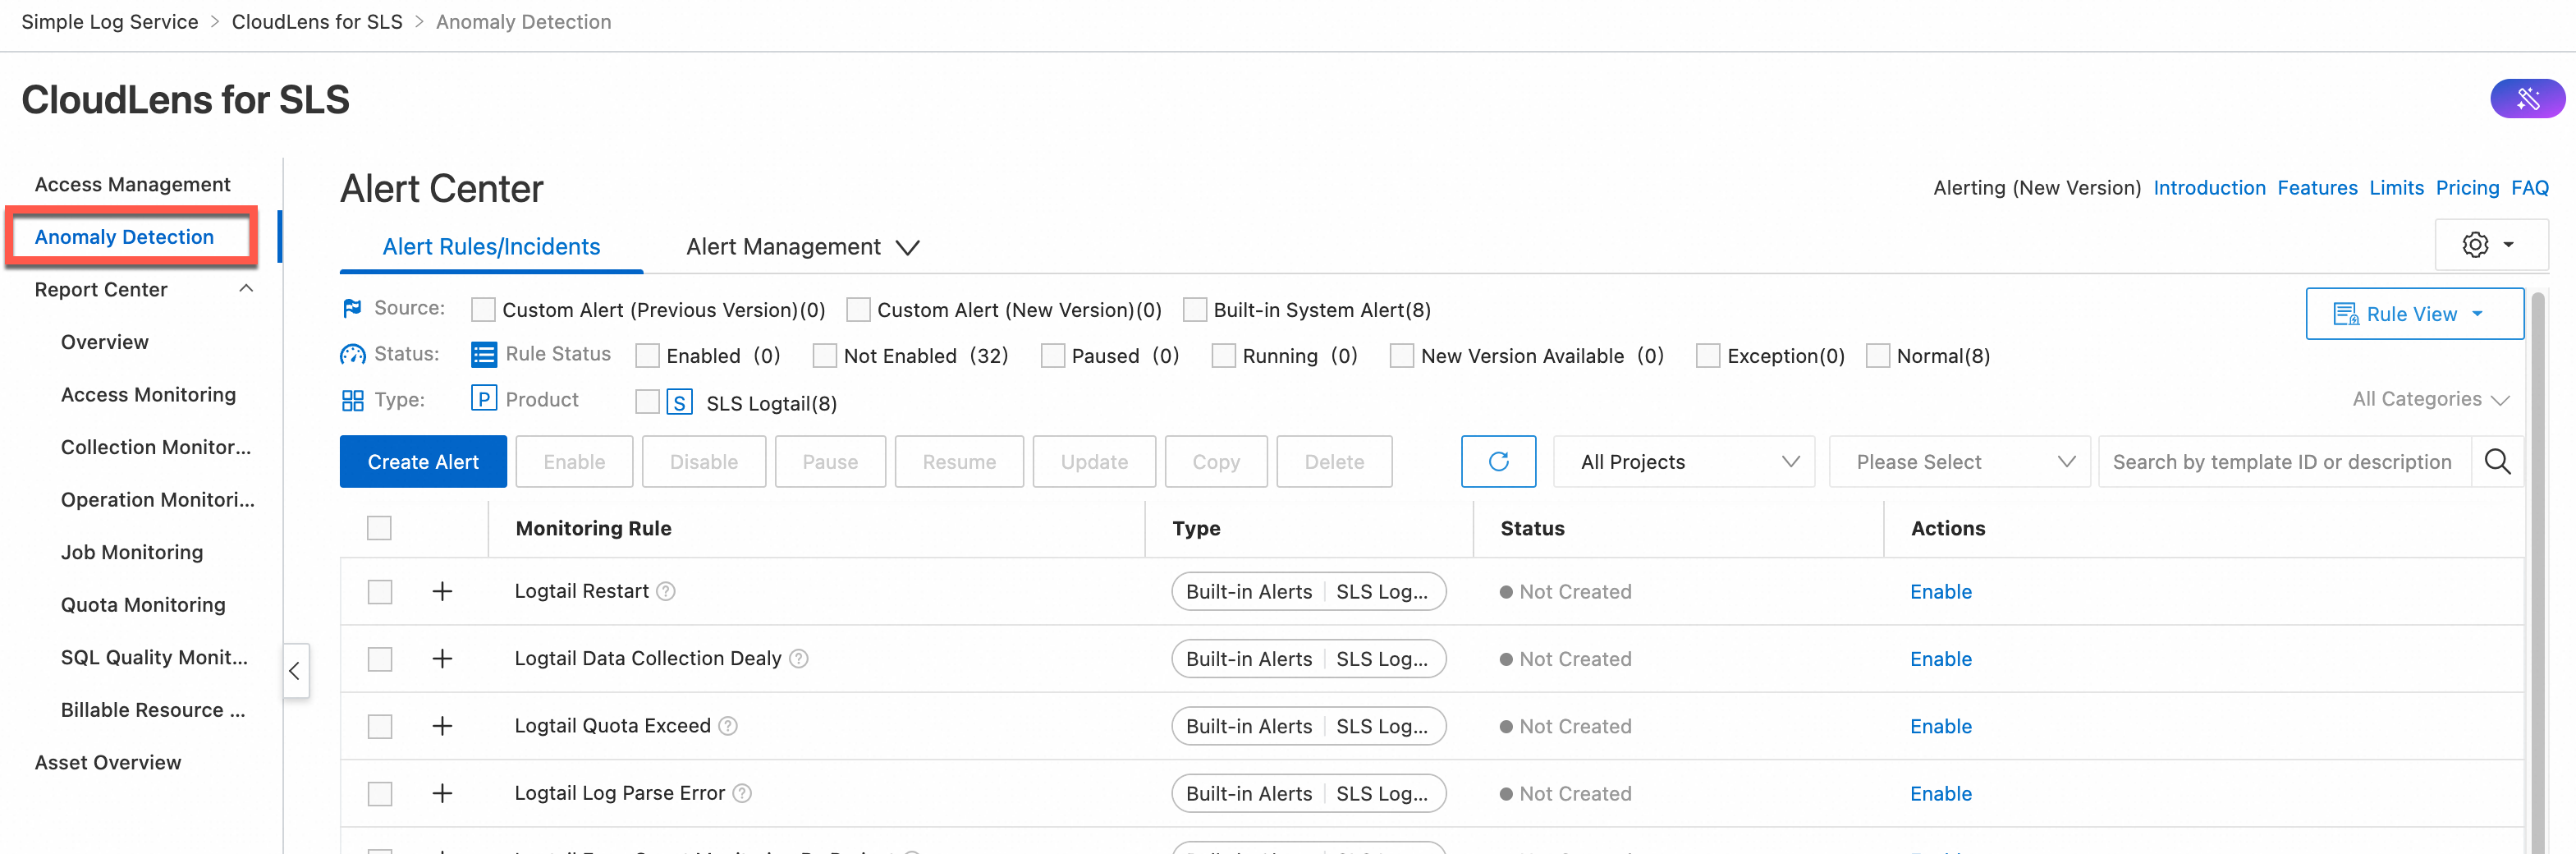
CloudLens for SLS provides preset alert monitoring rules such as baseline alerts and period-over-period comparison alerts to monitor the usage of resources like Projects, Logtail, and consumer groups. It supports notification methods including text messages, DingTalk, email, voice calls, and custom Webhooks. For more information, see Set alerts.
The application provides the following types of reports: Overview, Access Monitoring, Collection Monitoring, Operation Monitoring, Job Monitoring, Quota Monitoring, SQL Quality Monitoring, and Billable Resource Monitoring. For more information, see View data reports.
Centralized quota monitoring for all supported projects and logstores. For more information, see Supported regions.
Use cases
Development and operations (DevOps)
Developers can use CloudLens for SLS to monitor and manage assets such as projects and logstores in an efficient manner. In addition, the developers can query and analyze the instance logs of a project in CloudLens for SLS to efficiently troubleshoot errors. Instance logs are classified into detailed logs, important logs, and job operational logs.
IT operations
IT O&M personnel can use the alerting feature of CloudLens for SLS to identify and handle the exceptions of project service status, traffic, quotas, and Logtail metrics immediately.
Security auditing
The audit logs of CloudLens for SLS record the operations that create, update, and delete resources in a project. This lets security auditors analyze and audit operations within a specific period of time.
Asset details
Projects, logstores, and Metricstores: When enabling log collection, select a project as needed.
Important logs and job operational logs: SLS creates a logstore named internal-diagnostic_log.
Detailed logs: SLS creates a logstore named internal-operation_log.
Audit logs: SLS creates a logstore named internal-audit_log.
Error logs: SLS creates a logstore named internal-error_log.
Metrics: SLS creates a Metricstore named internal-monitor-metric.
Dashboard
Dashboard
Description
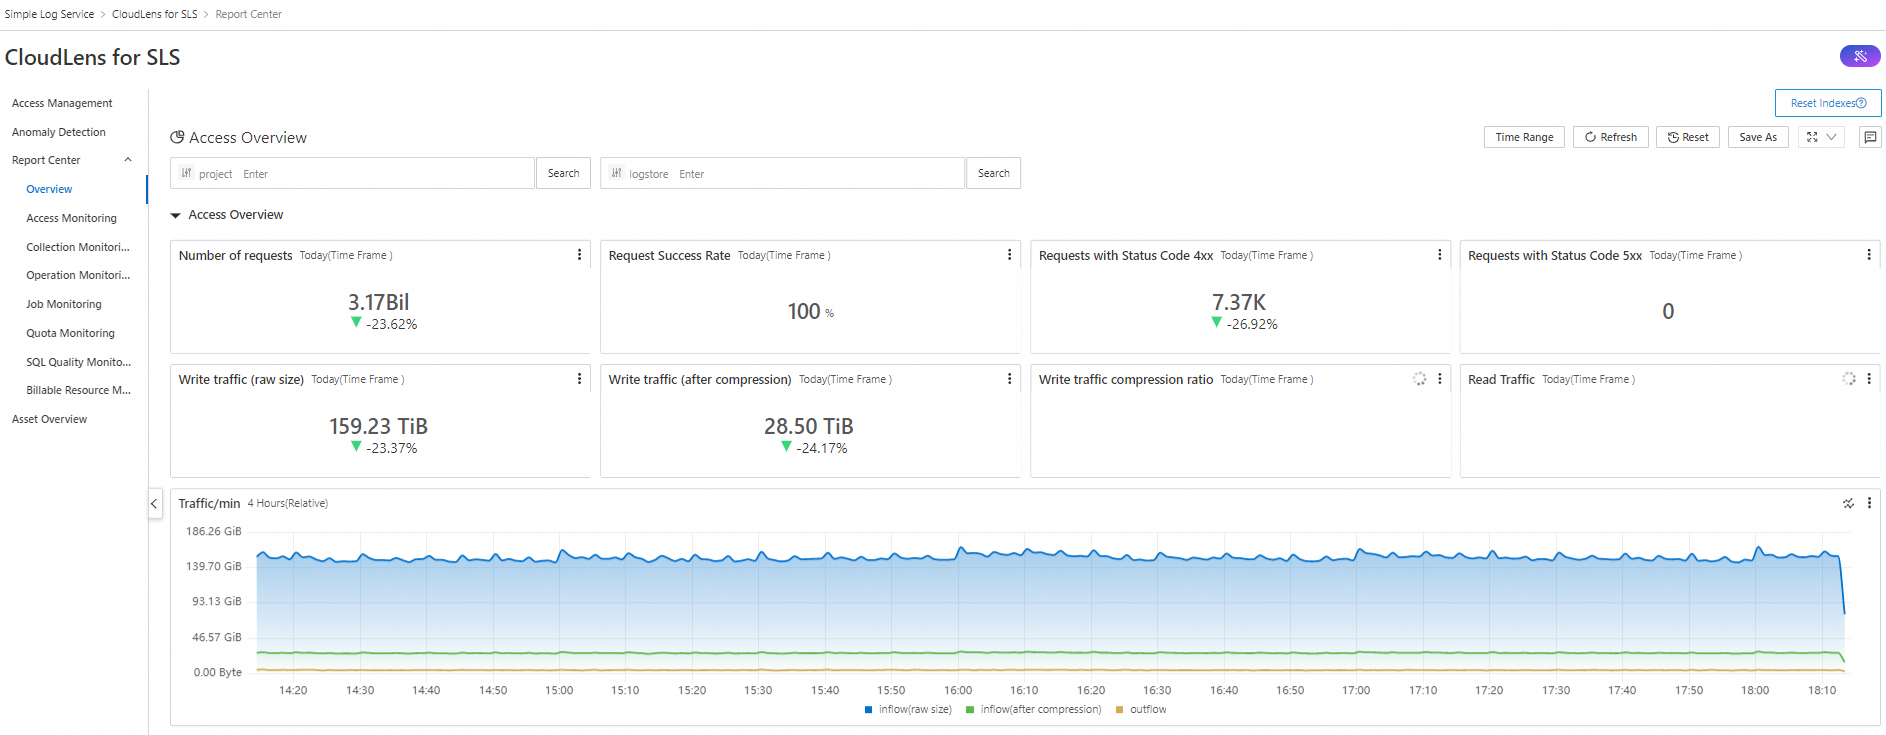
Overview
Overview
Displays information about SLS projects in charts. The charts include Number of requests, Request Success Rate, Requests with Status Code 4xx, Requests with Status Code 5xx, Write traffic (raw size), Write traffic (after compression), Write traffic compression ratio, and Read Traffic.
Access Monitoring
Access Traffic Monitoring
Displays information about access to SLS in charts. The charts include Total Requests, Clients, Users, Top 10 SourceIPs with Most Read Traffic, Top 10 SourceIPs with Most Write Traffic, Requests, Write Traffic, Trend of Write Traffic to Shards, Trend of Read Traffic from Shards, Read/Write Traffic/Minute, and Request IP Distribution.
Access Exception Monitoring
Displays information about abnormal access to SLS in charts. The charts include Total Requests, Percentage of Failed Requests, Quota Exceeded, Error Status Distribution, Logstore with Excessive Write Traffic, Error Requests, and Trend of Request Latency.
Consumer Group Monitoring
Displays information about consumer groups in charts. The charts include Consumer Group, Logstore, Shard, Consumption Latency, Data, Consumer Group List, Top 10 Latency, and Trend of Consumer Group Latency.
Collection Monitoring
Logtail Overall Status
Displays information about Logtail in charts. The charts include Active Logtail, Data Traffic, Status, CPU, Logtail Overall Status, Trend of CPU, Trend of Memory, and Data Sending Traffic.
Logtail File Collection Monitoring
Displays information about the files from which you want to collect logs in charts. The charts include Logtail File Collection, Machine Collection, Collection File Distribution, Trend of Log Collection, Trend of Average Latency, Trend of Parse Failure, and Trend of Send.
Logtail Exception Monitoring
Displays information about Logtail exceptions in charts. The charts include Active Logtail, Restart Logtail List, Restart Clients, and All Alarm.
Operation Monitoring
Operation Monitoring
Displays information about SLS operation records in charts. The charts include Logstore Related Operation Count, Logstore Related Fail Operation, and Clients.
Job Monitoring
Data Processing Monitoring
Displays information about data import jobs of the new version, data shipping jobs of the new version, and Scheduled SQL jobs in charts. The charts include Ingest Success, Ingest Failed, Deliver Success, Deliver Failed, Ingest PubNet, Deliver PubNet, Process Speed, Process Lags, Process Error, and Process State.
Quota Monitoring
Quota Monitoring
Displays information about quota exceeded events in charts. The charts include Overview of Resource Quota (80%) Warning, QuotaExceed, Logstore Usage Distribution, MachineGroup Usage Distribution, Logtail Config Usage Distribution, Project Write Inflow Usage Distribution, Project Overview of Basic Quota Usage, Project Overview of Write/Read Quota Usage, and Project Quota Exceeded Statistics.
SQL Quality Monitoring
SQL Quality Monitoring
Displays information about the quality of SQL statements in charts. The charts include SQL Health Score, SQL Metric, Running Metric, and SQL Pattern Analysis.
Billable Resource Monitoring
Billable Resource Monitoring
Displays information about billable resources in SLS, including Storage Space - Log Hot Storage, Index Traffic - Log Indexing, Read/Write Traffic, Trend of Billable Item Usage, Top Project Usage Details, and Top Logstore Usage Details.
Billing rules
CloudLens for SLS is free of charge. The following list describes the billing details for different types of logs:
You are not charged when you import, store, query, and analyze important logs, job operational logs, and audit logs. You are charged for data transformation and data shipping based on the pay-as-you-go billing method.
The billing method for detailed logs is the same as for any other logstore.
No additional fees are incurred by billing logs. The related projects and Tablestore instances are free of charge.
For more information, see Billable items of pay-by-feature.
Supported regions
Currently, CloudLens for SLS monitors and manages assets only in the following regions:
Cloud type | Region |
Alibaba Cloud public cloud | China (Hangzhou), China (Qingdao), China (Beijing), China (Zhangjiakou), China (Hohhot), China (Ulanqab), China (Shanghai), China (Chengdu), China (Shenzhen), China (Heyuan), China (Guangzhou), China (Hong Kong), Indonesia (Jakarta), Malaysia (Kuala Lumpur), Philippines (Manila), Singapore, South Korea (Seoul), Thailand (Bangkok), Japan (Tokyo), UK (London), Germany (Frankfurt), UAE (Dubai), US (Silicon Valley), US (Virginia) |
Precautions
To use a CloudLens application, make sure that at least one project exists within your Alibaba Cloud account.
When you enable a CloudLens application, Simple Log Service automatically checks whether a project exists within your Alibaba Cloud account.
Check logic
The first time you enable a CloudLens application, Simple Log Service automatically checks whether a project exists within your Alibaba Cloud account. If no projects exist, Simple Log Service creates a project whose name is in the
aliyun-product-data-<Alibaba Cloud account ID>-cn-heyuanformat in the China (Heyuan) region.After you enable a CloudLens application, Simple Log Service automatically checks whether a project exists within your Alibaba Cloud account. If no projects exist, Simple Log Service does not create a project in the China (Heyuan) region. You can manually create a project. For more information about how to create a project, see Manage a project.
Delete a project
If you want to delete the project whose name is in the
aliyun-product-data-<Alibaba Cloud account ID>-cn-heyuanformat, open Cloud Shell and run the following command. Replace the Alibaba Cloud account ID based on your business scenario.aliyunlog log delete_project --project_name=aliyun-product-data-<Alibaba Cloud account ID>-cn-heyuan --region-endpoint=cn-heyuan.log.aliyuncs.comIf you want to delete other projects and logstores, follow the instructions provided in Manage Logstores and Manage a project.