CloudLens for SLS provides built-in dashboards to analyze and monitor SLS usage.
Prerequisites
Log collection is enabled for the target project, including important logs, detailed logs, job run logs, audit logs, billing logs, error logs, and monitoring metrics. Enable log collection.
Procedure
-
Log in to the Simple Log Service console.
-
In the Log Application section, on the Cloud Service Lens tab, click CloudLens for SLS.
-
In the left-side navigation pane, in the Report Center section, click the target report.
-
In the upper-left corner of the page, select the target Project.
Overview
The Overview dashboard shows project-level SLS metrics, including read/write request counts and success rates, HTTP 4xx/5xx error counts, write traffic (raw and compressed), compression ratio, and read traffic.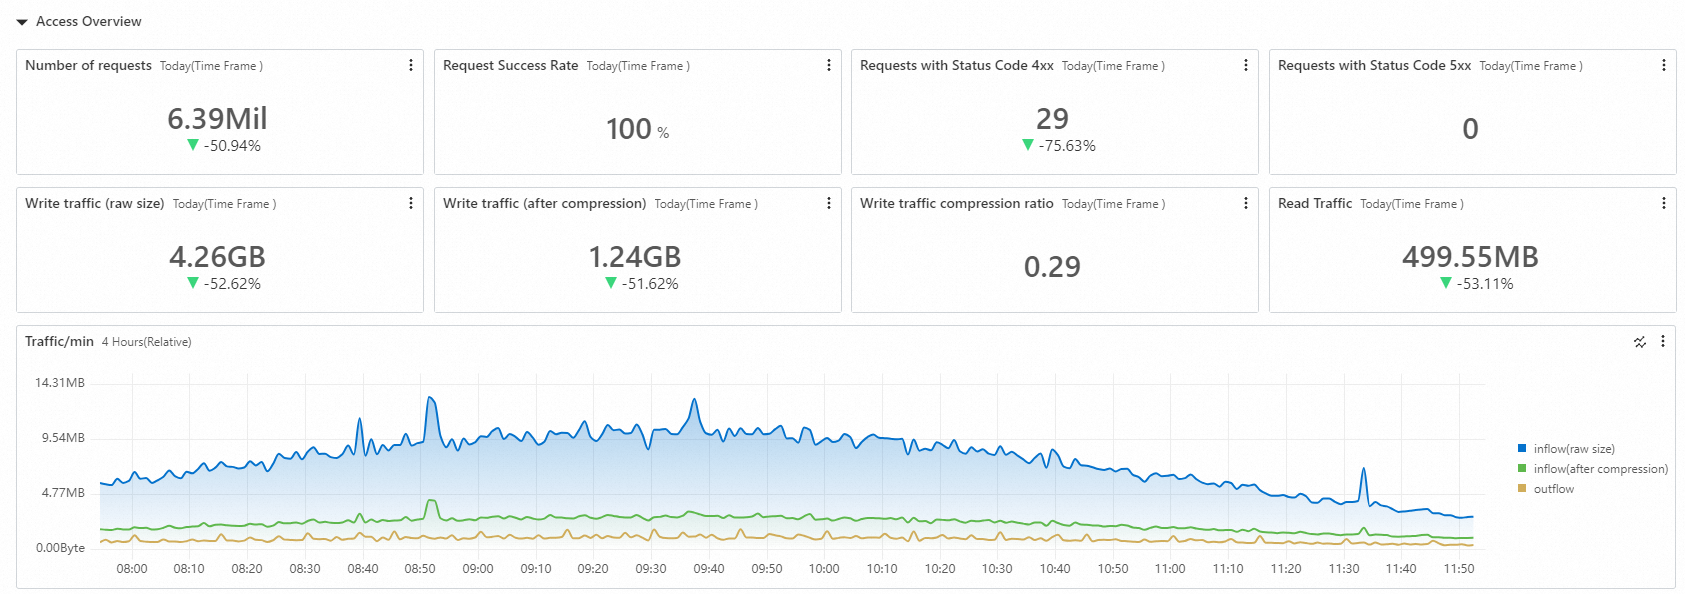
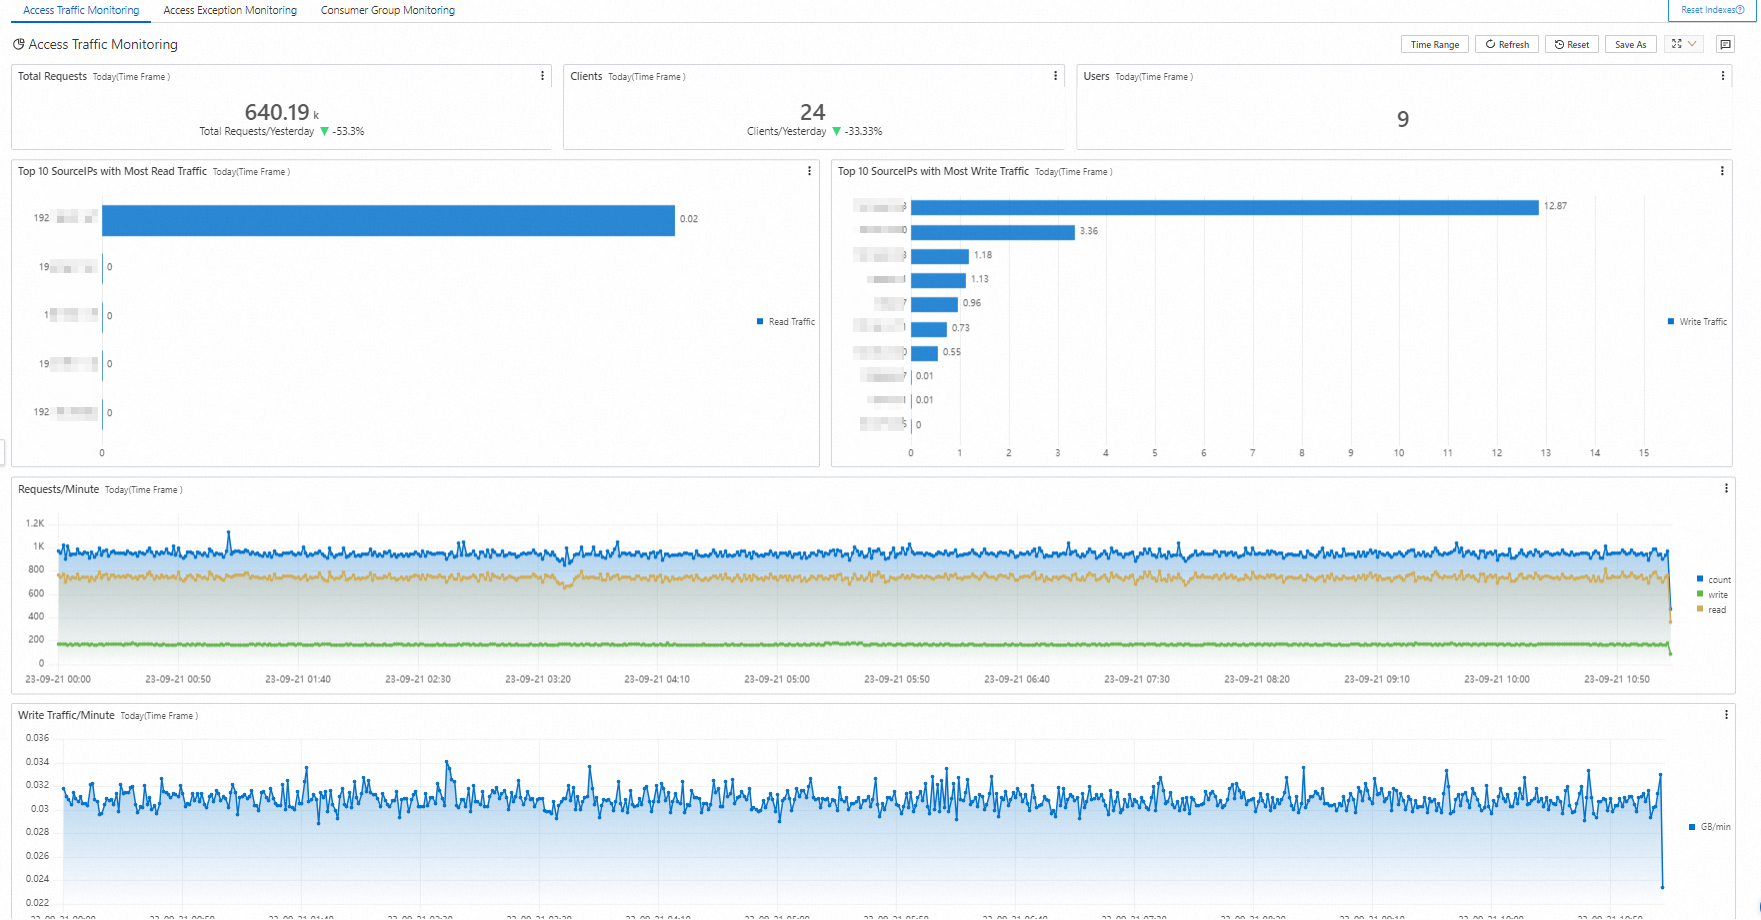
Access traffic
The Access Traffic Monitoring dashboard tracks SLS access metrics, including request counts, client and user counts, top 10 source IPs by read/write traffic, shard traffic trends, per-minute read/write network traffic trends, and access source distribution.
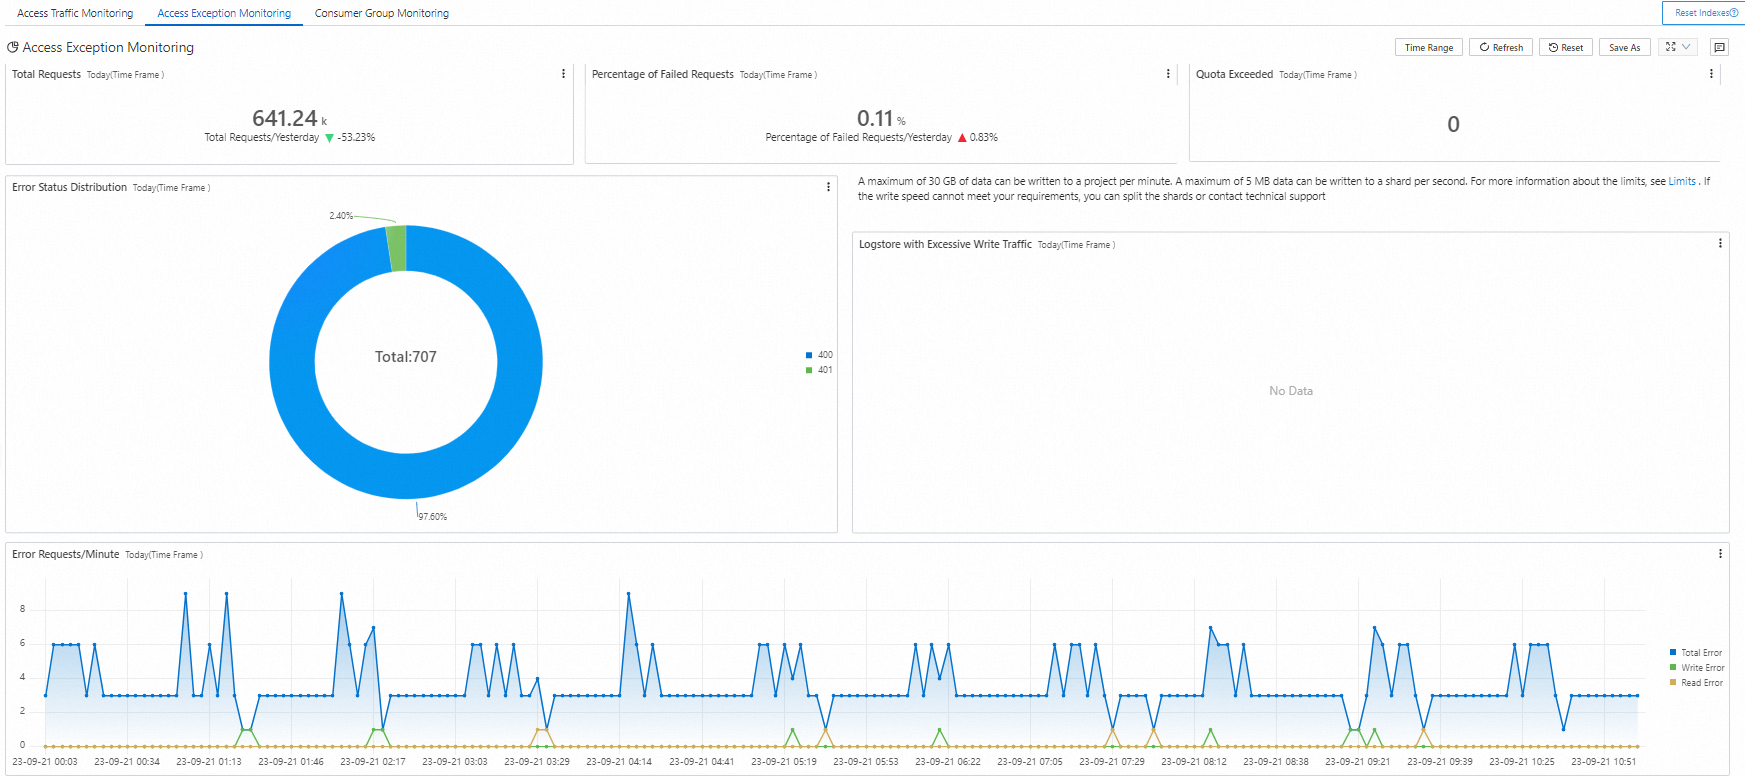
Access exceptions
The Access Exception Monitoring dashboard tracks SLS access anomalies, including today's total requests, failed request ratio, throttling errors, error status distribution, LogStores exceeding write limits, request error count, and request latency trends.
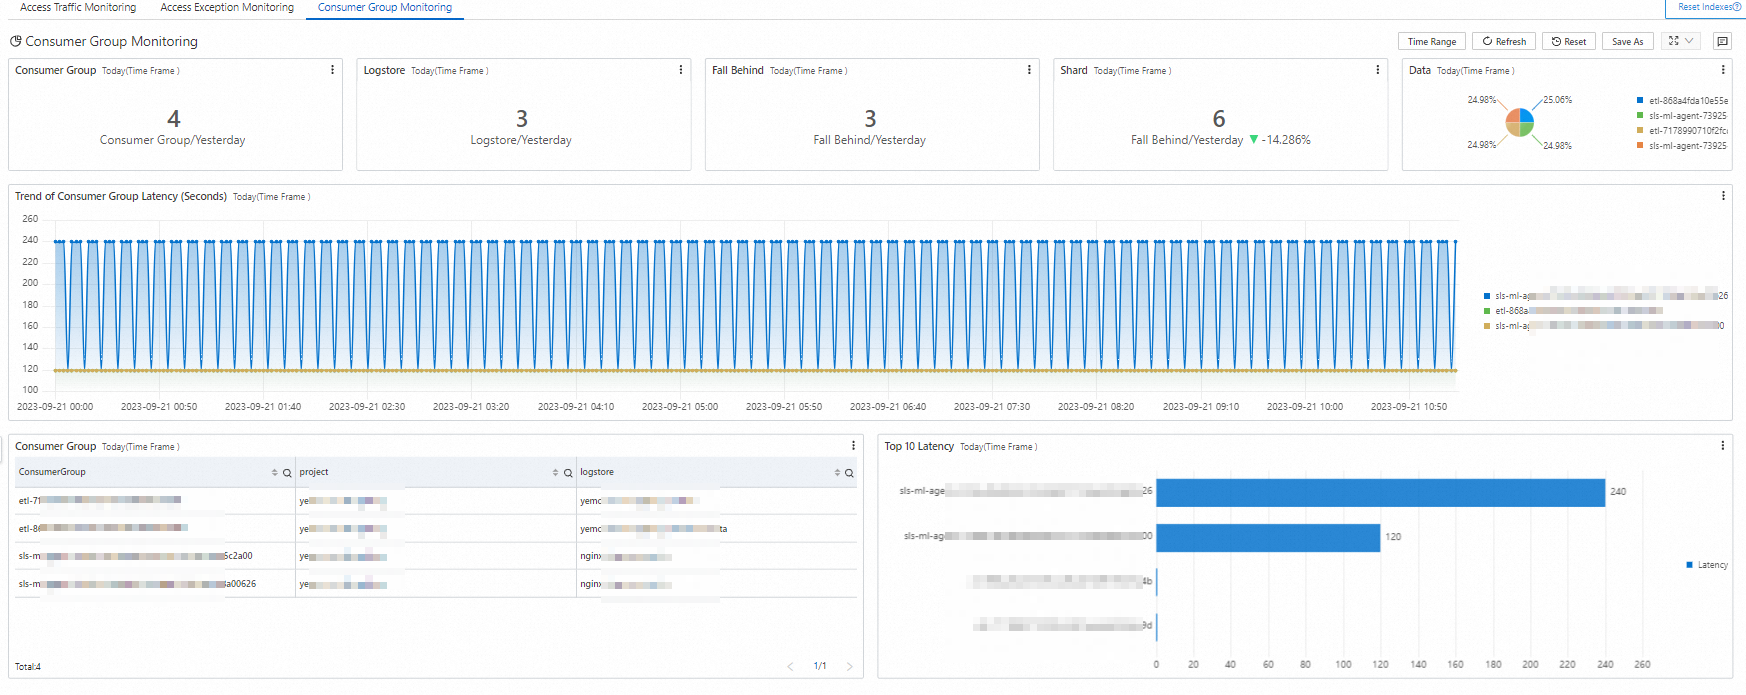
Consumer groups
The Consumer Group Monitoring dashboard tracks consumer group metrics, including group counts, consumed LogStores and shards, lagging groups, consumer group data ratio, consumer group list, top 10 groups by latency, and consumption lag duration.
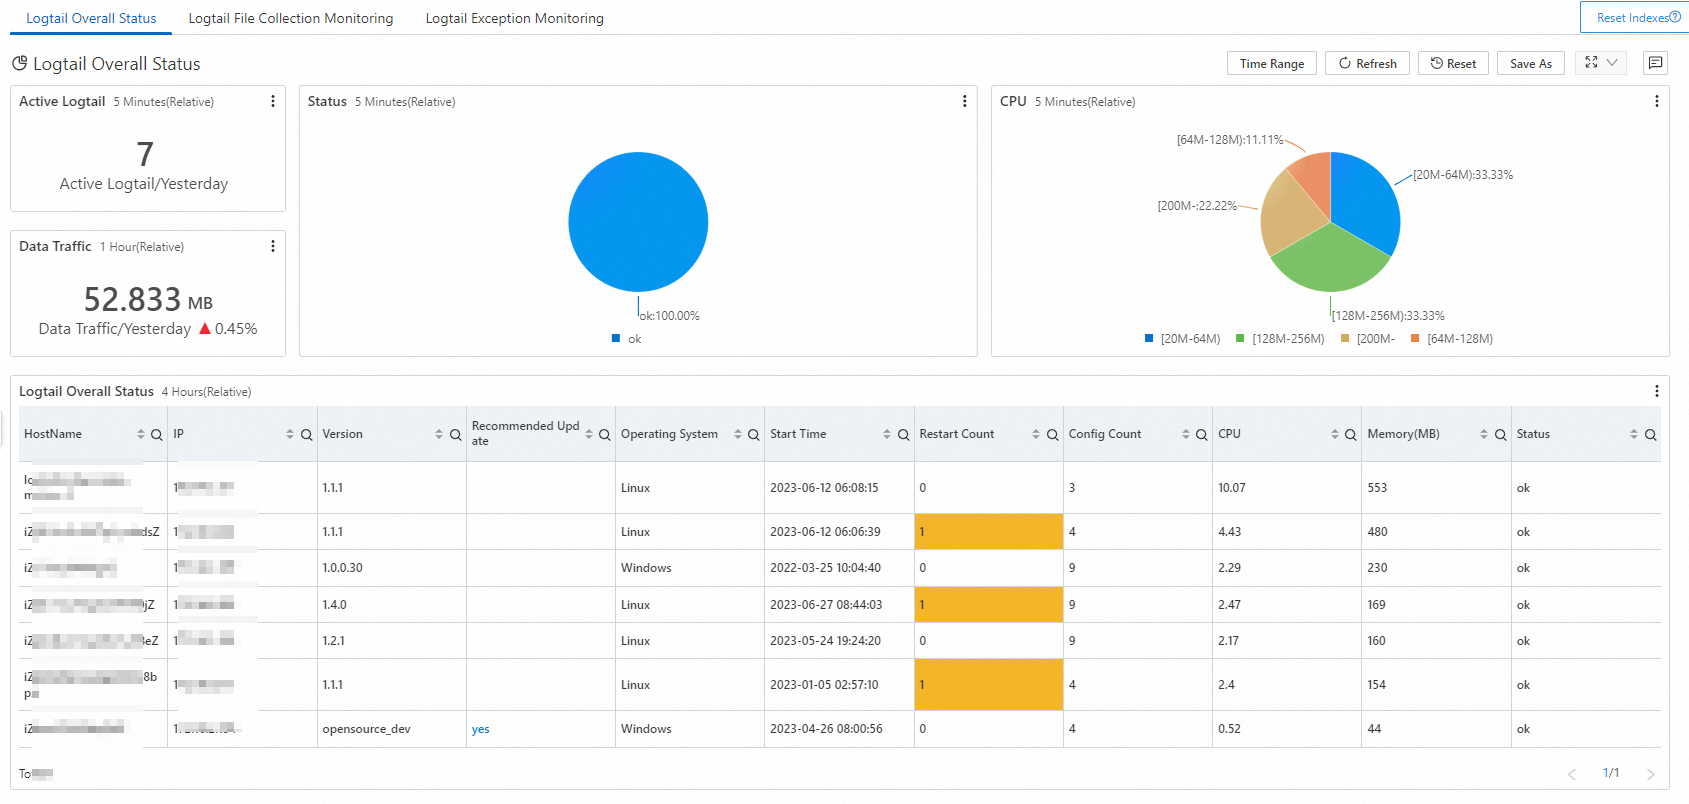
Logtail status
The Logtail Overall Status dashboard tracks Logtail health, including active agent counts, raw data traffic, running status distribution, memory usage distribution, overall Logtail status, CPU and memory trends, and data sending traffic.
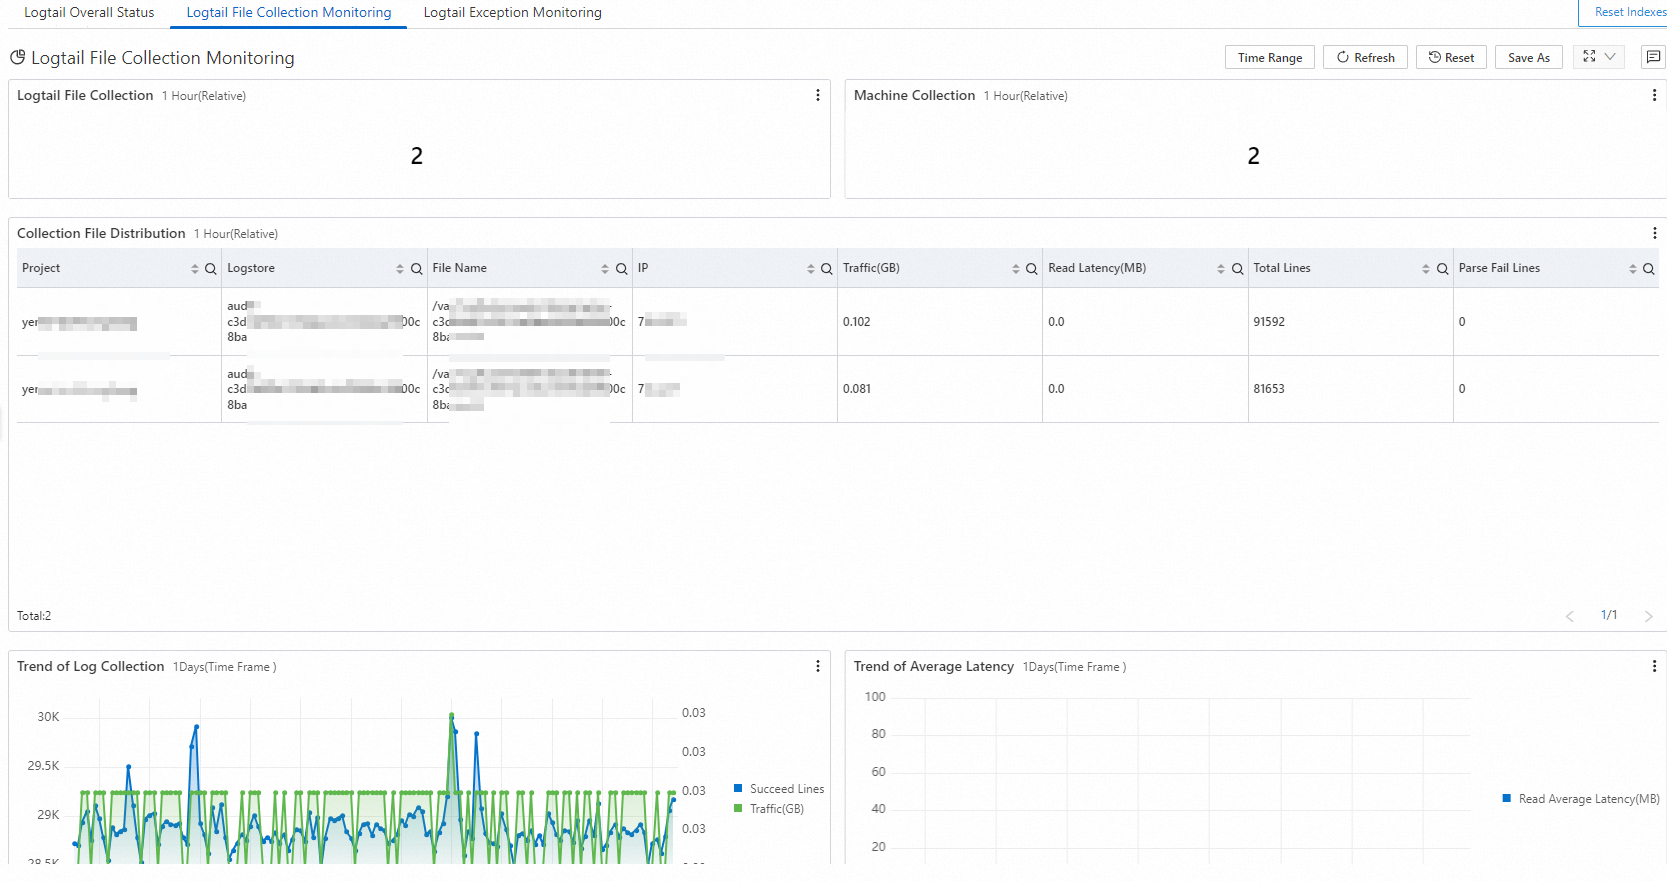
Logtail file collection
The Logtail File Collection Monitoring dashboard tracks file collection metrics, including file and machine counts, collected file distribution, log volume, collection latency, parsing failure rate, and sending trends.
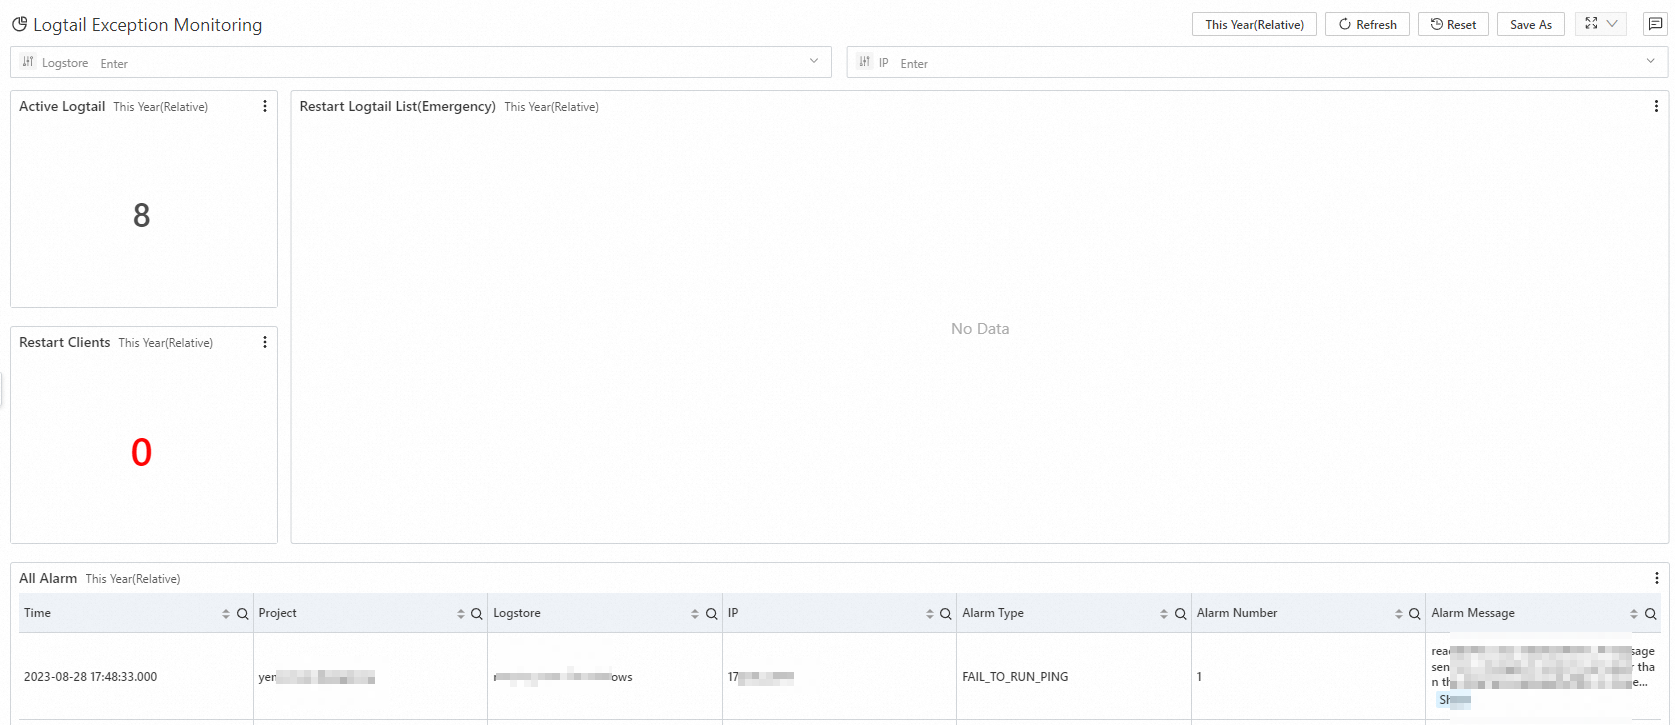
Logtail exceptions
The Logtail Exception Monitoring dashboard tracks Logtail exceptions, including active agent counts, restart history, restarted clients, and error messages.
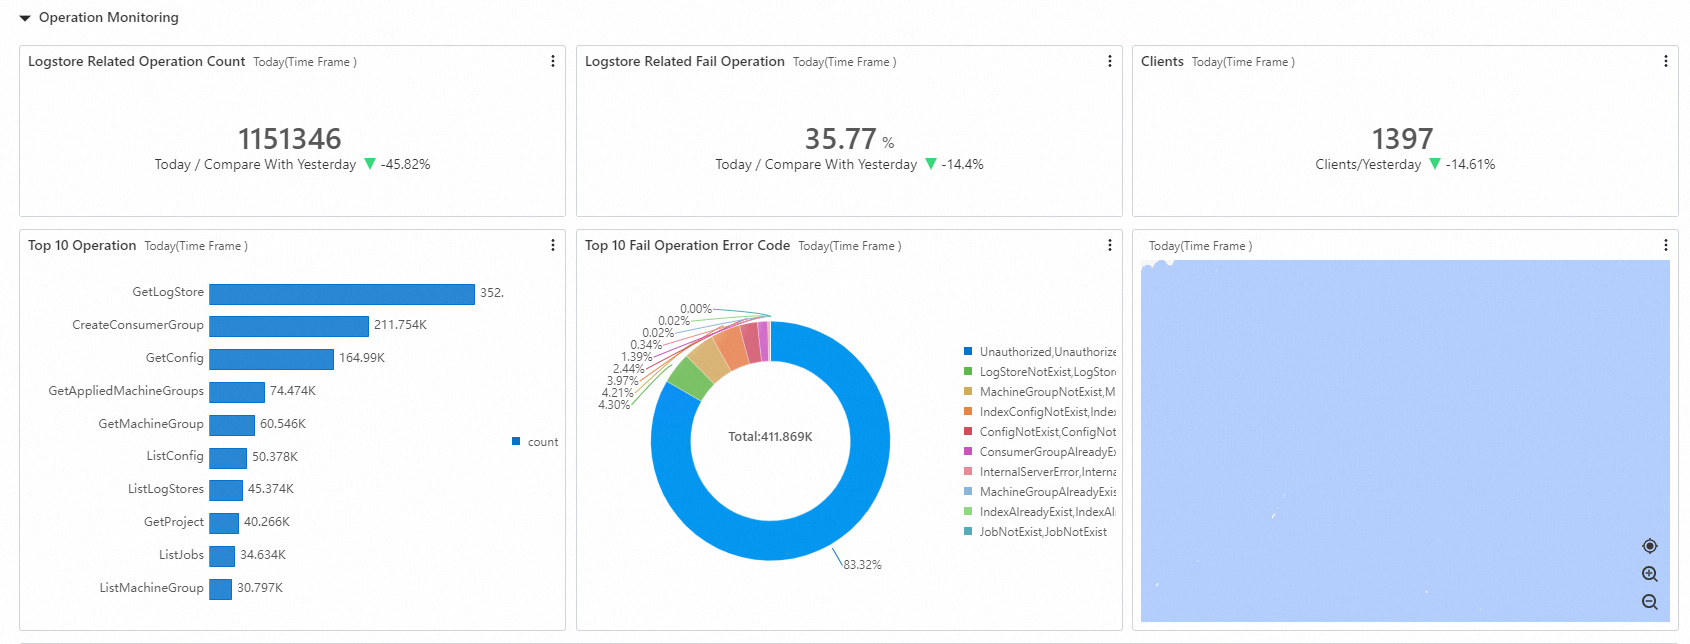
Operations
The Operation Monitoring dashboard tracks SLS operational records, including LogStore operation counts, failure rates, and operating client counts.
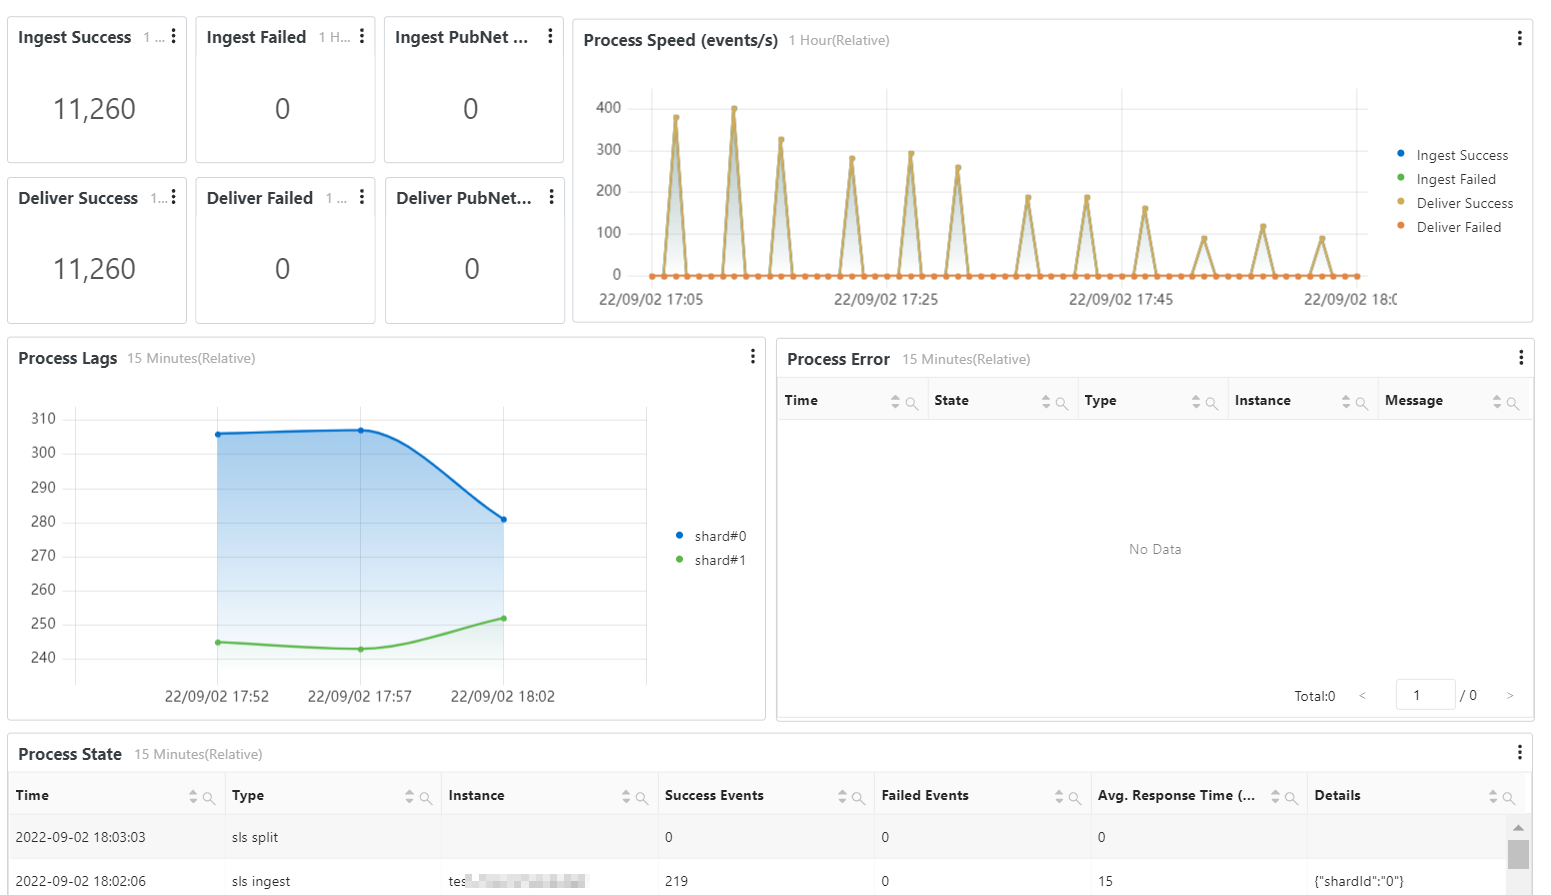
Jobs
The Job Monitoring dashboard tracks data import jobs (new version), data shipping jobs (new version), and Scheduled SQL jobs. Charts include read/write success and failure counts, public read traffic, public write traffic, processing rate, progress lag, and runtime exceptions.
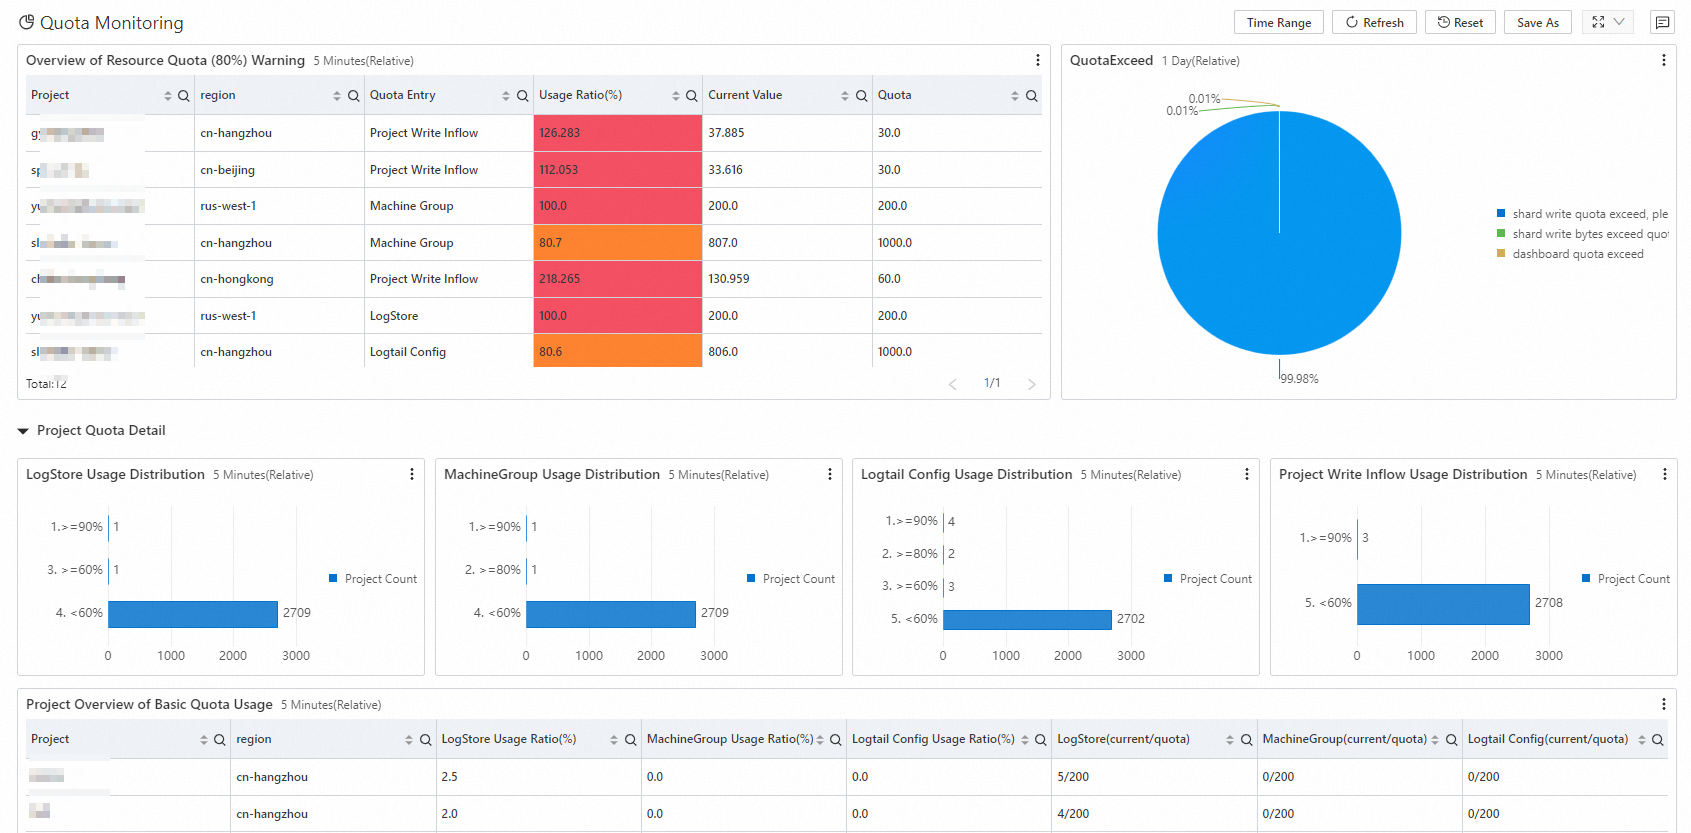
Quotas
The Quota Monitoring dashboard tracks resource quota usage. Charts include quotas reaching the 80% warning threshold, overage distribution, usage levels for LogStores, machine groups, Logtail configurations, and project write traffic, Project basic resource quota details, Project data read/write resource quota details, and Project resource overage details.
SQL quality
The SQL Quality Monitoring dashboard analyzes SQL query performance across multiple dimensions, including service metrics, query patterns, and optimization advice.
The dashboard includes the following sections:
-
Overview
-
SQL Service Metrics
-
Runtime Detail Metrics
-
SQL Pattern Analysis
-
Optimization and Suggestions
Overview
Displays the SQL health score, usage report, and overall performance.
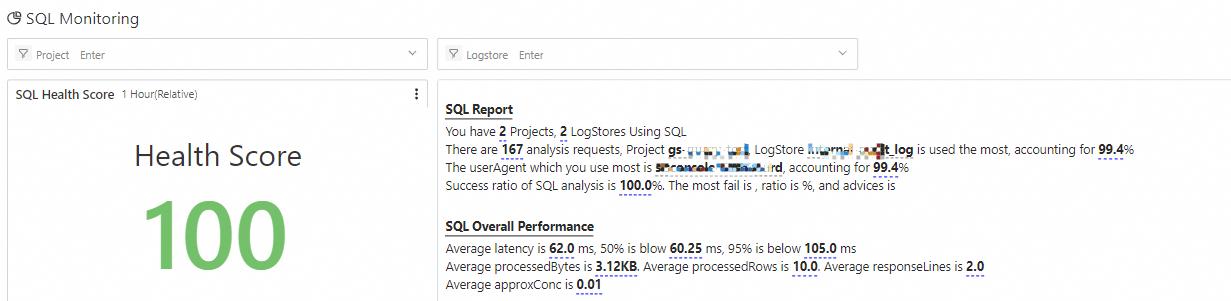
SQL health score
The health score is calculated with the following formula: (1 - Query Failure Rate) * 100.
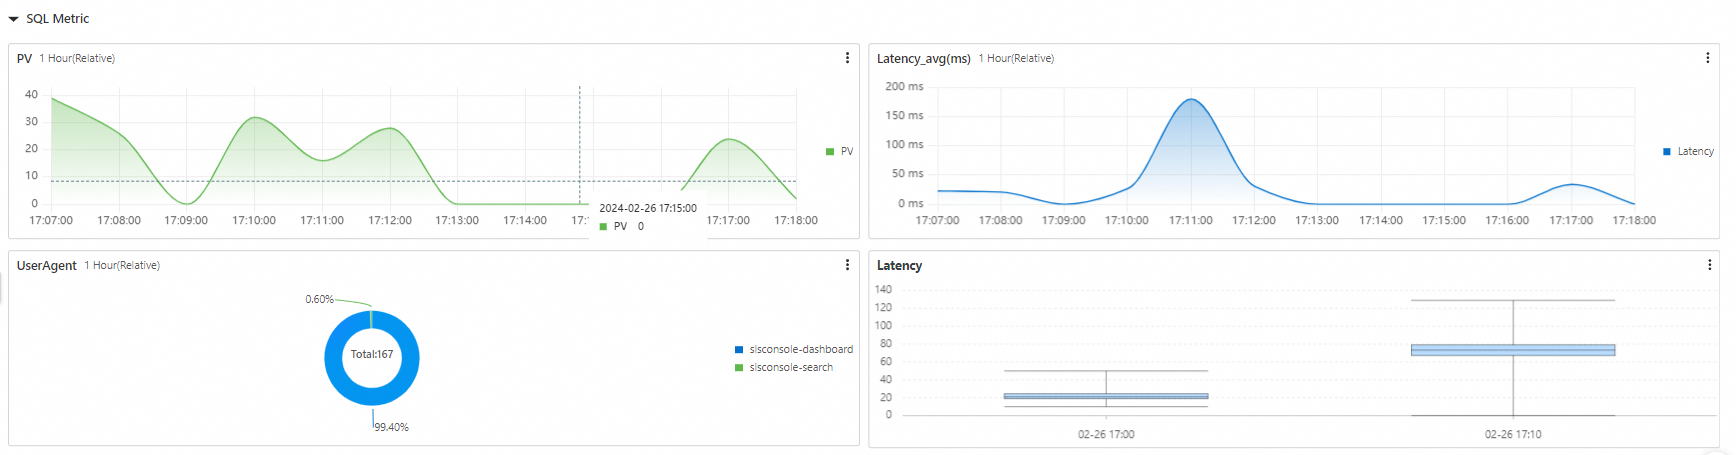
SQL service metrics
Shows SQL service metrics, including requests per minute (PV), average latency, user agent distribution, and latency distribution.
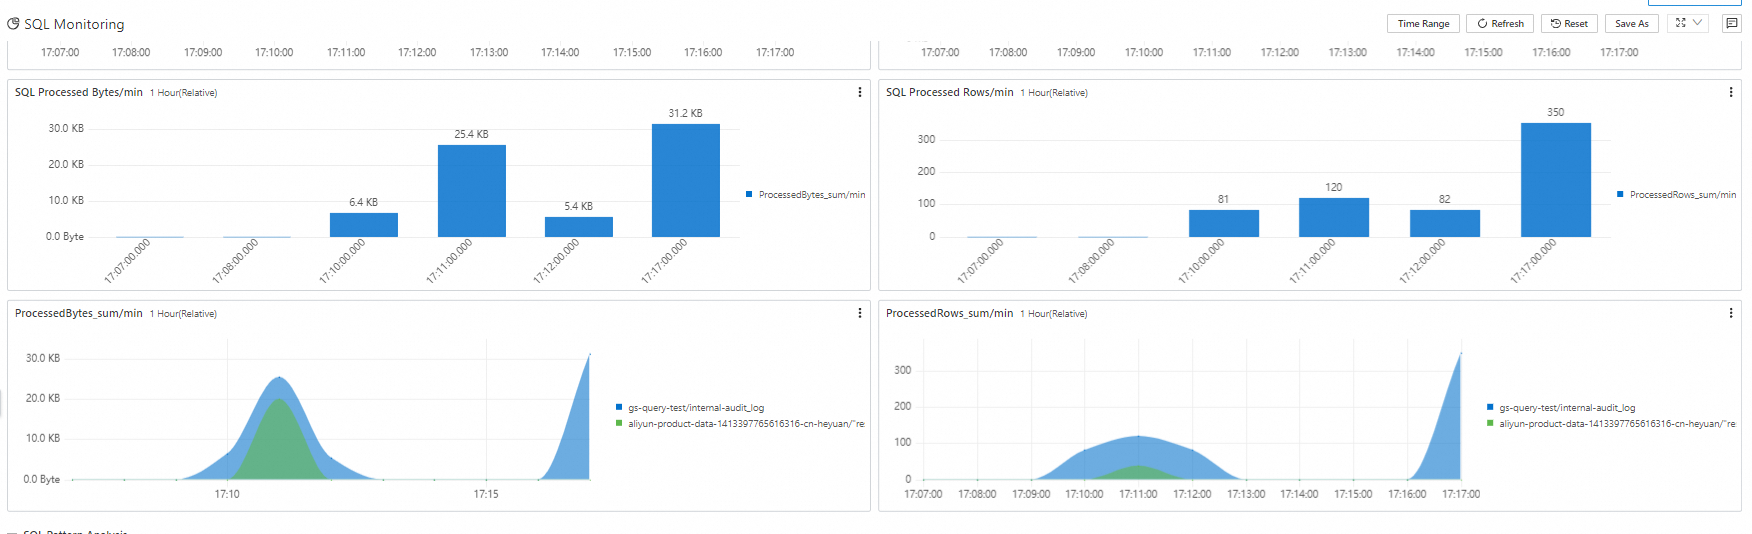
Runtime detail metrics
Shows core SQL runtime metrics, including concurrent request volume, per-phase latency, processed bytes per minute, and processed rows per minute.
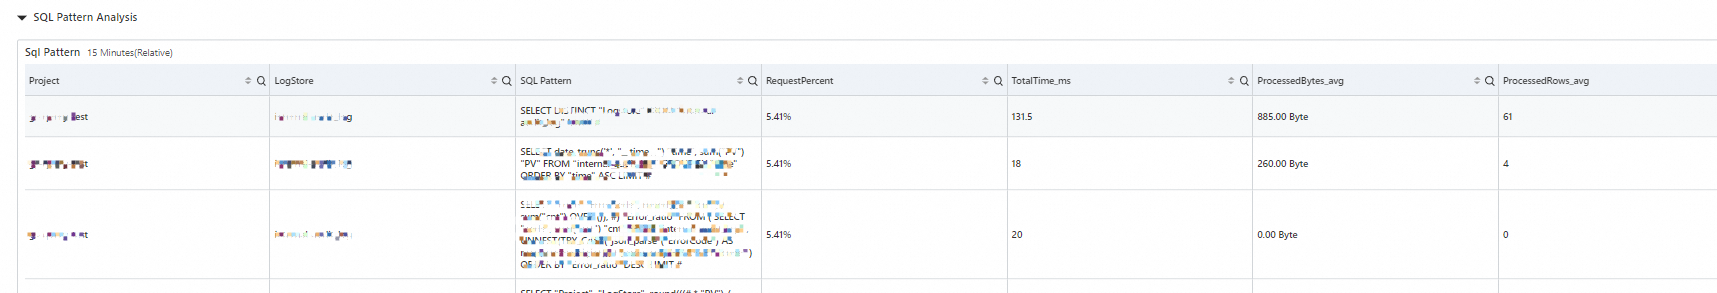
SQL patterns
Groups queries into patterns by template to identify the most frequently executed patterns and those that consume the most resources.
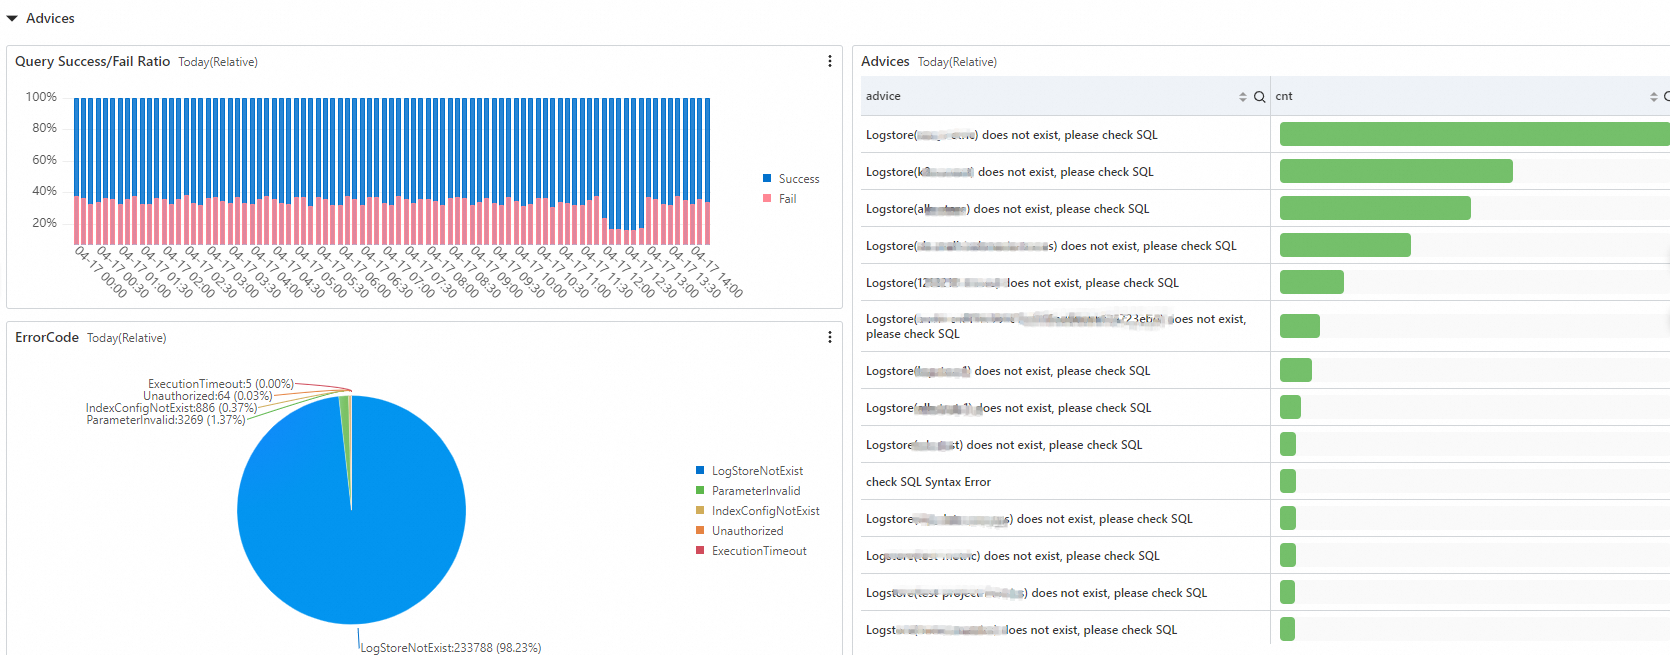
Optimization and suggestions
Analyzes failed SQL queries and provides optimization suggestions.
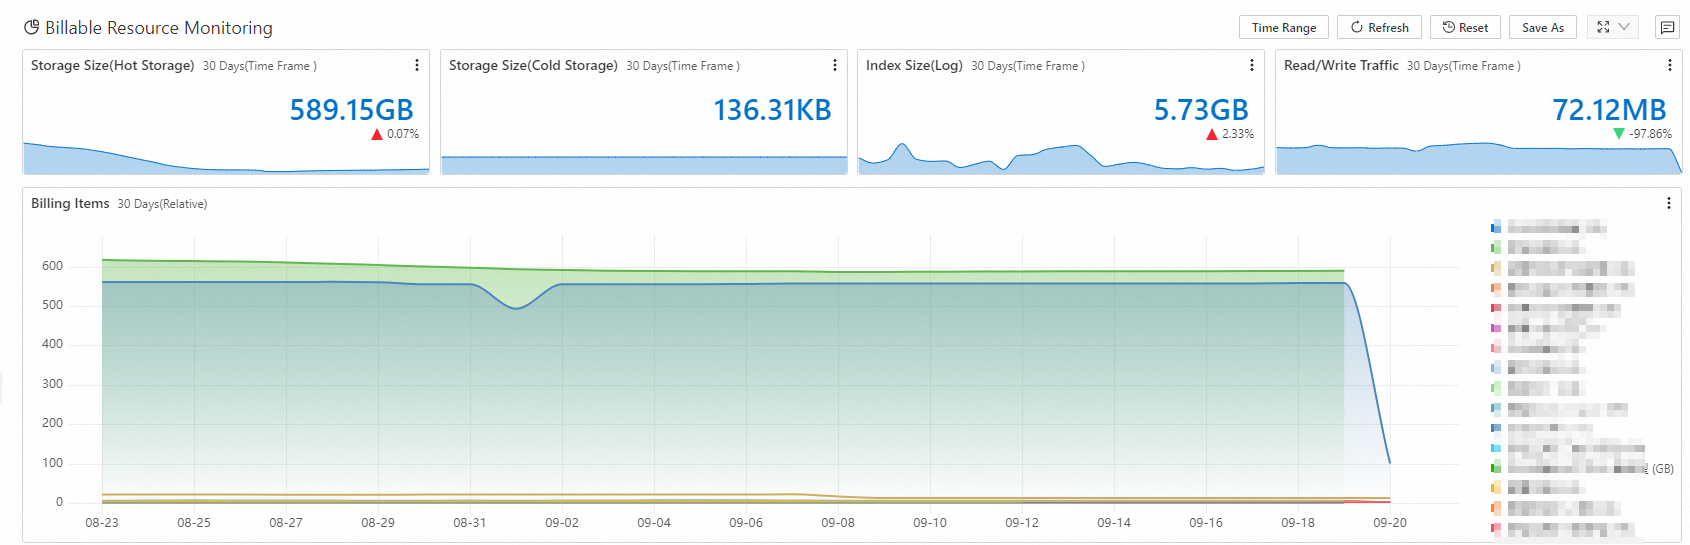
Billable resources
The Billable Resource Monitoring dashboard tracks SLS billable resources, including hot and cold storage, index traffic, read/write traffic, usage trends after resource plan deductions, and top project and LogStore usage.