Simple Log Service collects and analyzes Nginx access logs across multiple dimensions, helping you monitor website traffic, diagnose latency issues, and configure alerts with built-in example queries.
Prerequisites
Nginx access logs are collected. Collect text logs by using the Nginx configuration mode.
The data import wizard automatically generates an index based on log fields. To modify the index, follow Create an index.
Overview
Nginx logs are essential for website operations. Traditional approaches such as CNZZ require frontend JavaScript injection, while stream-based or offline computing demands complex infrastructure and sacrifices either real-time capability or analytical flexibility.
Simple Log Service collects Nginx logs through the data import wizard and automatically creates an index and dashboard. The nginx_Nginx access log dashboard shows source IP distribution, request statuses, user agents, PV/UV trends, traffic statistics, top referrers, and top accessed URLs. You can also write custom queries to analyze latency patterns and configure alerts for errors or traffic anomalies.
Analyze website traffic
Log on to the Simple Log Service console.
In the Projects section, click the one you want.

-
In the left-side navigation pane, choose . Click the > icon to the left of the desired Logstore.
-
Under Dashboard, click nginx_Nginx access log.
The nginx_Nginx access log dashboard includes these charts:
-
The Distribution of source IP addresses chart shows the geographic distribution of request IPs over the last day. Query:
* | select count(1) as c, ip_to_province(remote_addr) as address group by address limit 100 -
The Distribution of request statuses chart shows the percentage of each HTTP status code over the last day. Query:
 * | select count(1) as pv,
         status
         group by status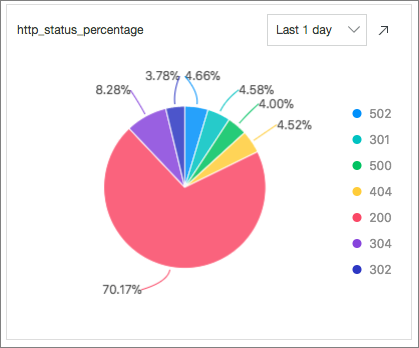
-
The Distribution of request methods chart shows the percentage of each request method over the last day. Query:
* | select count(1) as pv ,request_method group by request_method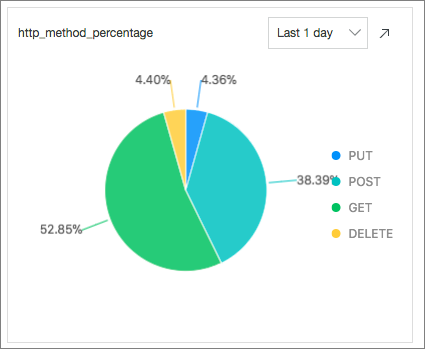
-
The Distribution of user agents chart shows the percentage of different browsers over the last day. Query:
* | select count(1) as pv, case when http_user_agent like '%Chrome%' then 'Chrome' when http_user_agent like '%Firefox%' then 'Firefox' when http_user_agent like '%Safari%' then 'Safari' else 'unKnown' end as http_user_agent group by case when http_user_agent like '%Chrome%' then 'Chrome' when http_user_agent like '%Firefox%' then 'Firefox' when http_user_agent like '%Safari%' then 'Safari' else 'unKnown' end order by pv desc limit 10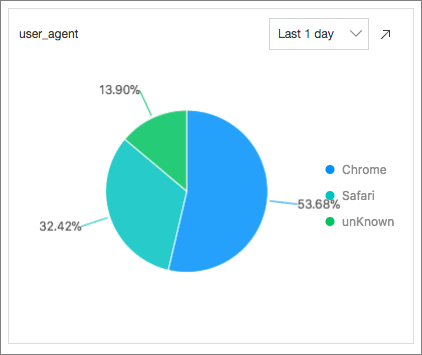
-
The Top 10 referrers chart shows the top 10 referrer pages by PV over the last day. Query:
* | select count(1) as pv , http_referer group by http_referer order by pv desc limit 10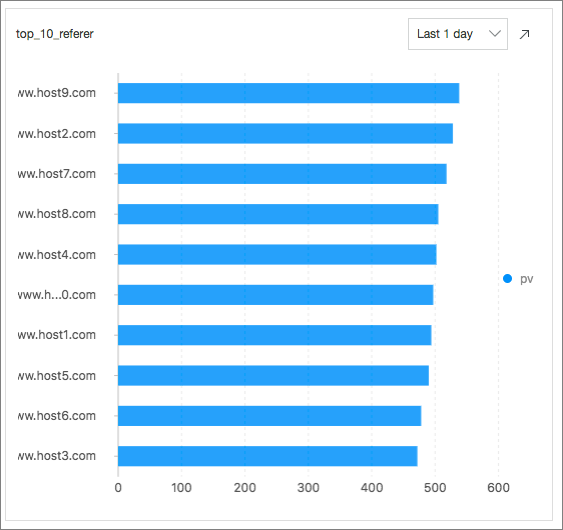
-
The Inbound and outbound traffic statistics chart shows inbound and outbound traffic over the last day. Query:
* | select sum(body_bytes_sent) as net_out, sum(request_length) as net_in ,date_format(date_trunc('hour', __time__), '%m-%d %H:%i') as time group by date_format(date_trunc('hour', __time__), '%m-%d %H:%i') order by time limit 10000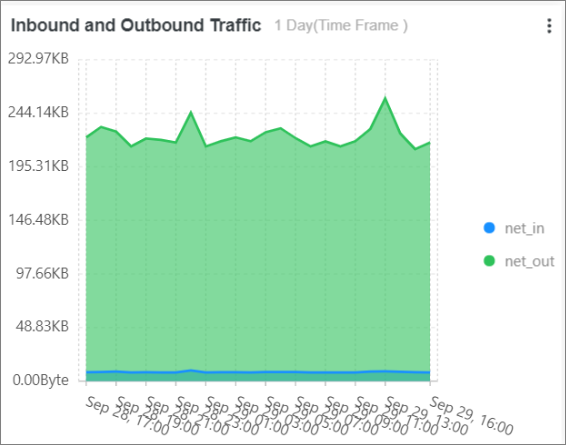
-
The PV/UV statistics chart shows PV and UV counts over the last day. Query:
*| select approx_distinct(remote_addr) as uv ,count(1) as pv , date_format(date_trunc('hour', __time__), '%m-%d %H:%i') as time group by date_format(date_trunc('hour', __time__), '%m-%d %H:%i') order by time limit 1000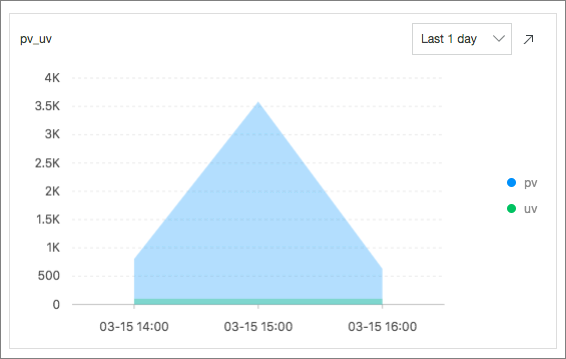
-
The PV forecast chart predicts PV for the next 4 hours. Query:
* | select ts_predicate_simple(stamp, value, 6, 1, 'sum') from (select __time__ - __time__ % 60 as stamp, COUNT(1) as value from log GROUP BY stamp order by stamp) LIMIT 1000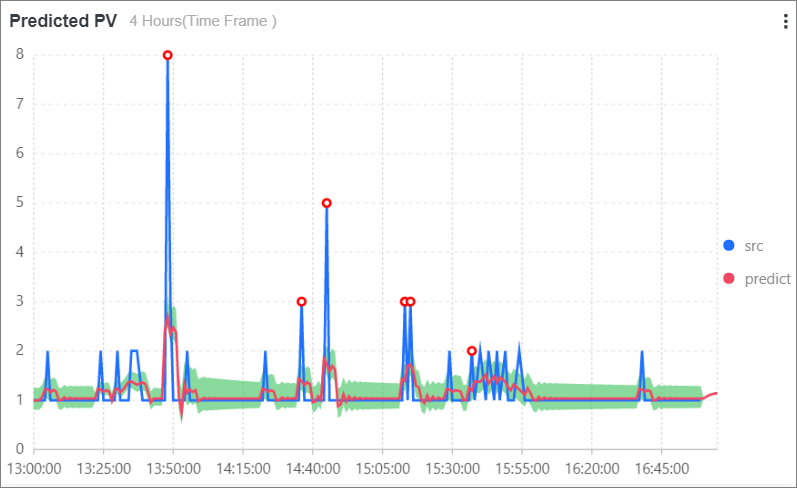
-
The Top 10 accessed URLs chart shows the top 10 most requested URLs by PV over the last day. Query:
* | select count(1) as pv, split_part(request_uri,'?',1) as path group by path order by pv desc limit 10
-
Diagnose and optimize website performance
Monitor request latency to identify slow pages and optimize performance. Use custom queries to analyze latency patterns. For the query syntax, see Quick start for search and analysis.
-
Calculate the average and maximum request latency at 5-minute intervals to understand overall latency trends.
* | select from_unixtime(__time__ -__time__% 300) as time, avg(request_time) as avg_latency , max(request_time) as max_latency group by __time__ -__time__% 300 -
Identify the pages with the highest latency to guide optimization efforts.
* | select from_unixtime(__time__ - __time__% 60) , max_by(request_uri,request_time) group by __time__ - __time__%60 -
Group latency values into 10 bins to visualize the distribution.
* |select numeric_histogram(10,request_time) -
Get the top 10 latency values and their corresponding requests.
* | select max(request_time,10) -
Optimize the highest-latency page.
For example, if /url2 has the highest latency, optimize the /url2 page by calculating its PV, UV, request methods, status codes, browsers, average latency, and maximum latency for /url2.
request_uri:"/url2" | select count(1) as pv, approx_distinct(remote_addr) as uv, histogram(method) as method_pv, histogram(status) as status_pv, histogram(user_agent) as user_agent_pv, avg(request_time) as avg_latency, max(request_time) as max_latency -
Compare today's page view (PV) with yesterday's PV (Debug).
* | select diff [1] as today, round((diff [3] -1.0) * 100, 2) as growth FROM ( SELECT compare(pv, 86400) as diff FROM ( SELECT COUNT(1) as pv FROM log ) ) -
Calculate the day-over-day change in page views (PVs).
* |
select
  t,
  diff [1] as today,
  diff [2] as yestoday,
  diff [3] as percentage
from(
    select
      t,
      compare(pv, 86400) as diff
    from
      (
        select
          count(1) as pv,
          date_format(from_unixtime(__time__), '%H:%i') as t
        from
          log
        group by
          t
        limit
          10000
      )
    group by
      t
    order by
      t
    limit
      10000
  )
Set up alerts
Configure alerts for latency spikes, server errors, and traffic anomalies. For the full procedure, see Set up an alert.
-
Error alert
Monitor HTTP 500 (server error) responses. The following query counts errors (c) per time unit. Set the alert trigger condition to c > 0.
status:500 | select count(1) as cNoteFor high-traffic services where occasional 500 errors are expected, set the Notification Trigger Threshold to 2. This triggers an alert only when the condition is met in two consecutive checks.
In the create alert dialog box, set Alert Name to
Error Alert. For Add to Dashboard, select Create and specify the dashboard name asNginx. Set Chart Name toError Alert, Query Interval to 1 Day (On the Hour), and Check Frequency to a Fixed Interval of 15 Minutes. Finally, set Notification Interval to 5 Minutes. -
Performance alert
Create a latency alert. The following query calculates the average latency of all
Postrequests to the/adduserendpoint. Set the trigger condition to l > 300000 to alert when average latency exceeds 300 ms.Method:Post and URL:"/adduser" | select avg(request_time) as lAverage-based alerts can mask individual high-latency requests. Use a percentile such as P99 as the trigger condition instead. The following query calculates the 99th percentile latency.
Method:Post and URL:"/adduser" | select approx_percentile(request_time, 0.99) as p99For monitoring, calculate the average, P50, and P99 latency per minute over a one-day window of 1,440 minutes.
* | select avg(request_time) as l, approx_percentile(request_time, 0.5) as p50, approx_percentile(request_time, 0.99) as p99, date_trunc('minute', time) as t group by t order by t desc limit 1440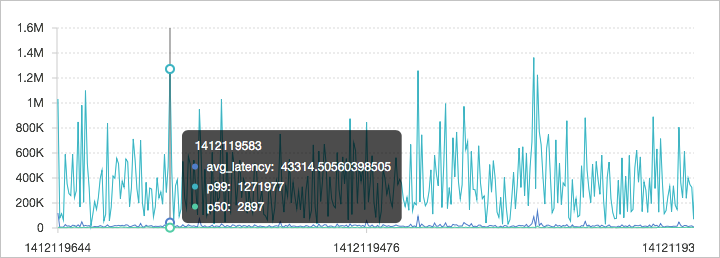
-
Traffic spike or drop alert
Sudden traffic drops or spikes typically indicate anomalies. Detect them by comparing current traffic against one of the following baselines:
-
The previous time window.
-
The same time window on the previous day.
-
The same time window in the previous week.
The following example uses the first method to calculate the rate of change over a 5-minute query range.
-
Define a calculation window.
Define a 1-minute window to calculate traffic per minute.
* | select sum(inflow)/(max(__time__)-min(__time__)) as inflow , __time__-__time__%60 as window_time from log group by window_time order by window_time limit 15The result contains two columns:
window_timeandinflow. Theinflowcolumn shows the traffic value for each 1-minute window. -
Calculate the difference within the window.
-
Calculate the ratio of the maximum or minimum value to the average value. This example uses the maximum ratio (max_ratio).
In this example,
max_ratiois 1.02. Set the alert condition to max_ratio > 1.5 (rate of change exceeds 50%) to trigger an alert.* | select max(inflow)/avg(inflow) as max_ratio from (select sum(inflow)/(max(__time__)-min(__time__)) as inflow , __time__-__time__%60 as window_time from log group by window_time order by window_time limit 15) -
Calculate the rate of change for the most recent value to check if traffic is fluctuating or has returned to normal.
Use the max_by function to get the maximum traffic in the window. A
latest_ratioof 0.97 means the latest traffic is 97% of the average.* | select max_by(inflow, window_time)/1.0/avg(inflow) as latest_ratio from (select sum(inflow)/(max(__time__)-min(__time__)) as inflow , __time__-__time__%60 as window_time from log group by window_time order by window_time limit 15)NoteThe result of the max_by function is of the string type and must be cast to a numeric type. If you want to calculate the relative rate of change, you can use (1.0-max_by(inflow, window_time)/1.0/avg(inflow)) as latest_ratio.
-
Calculate the volatility, which is the change between the value of the current window and the previous window.
Use the
lagwindow function to compute the difference between current traffic inflow and the previous period inflow "lag(inflow, 1, inflow)over() ", divided by current inflow. A significant drop (such as at 11:39) shows a rate of change exceeding 40%.NoteUse the abs function to calculate an absolute rate of change.
* | select (inflow- lag(inflow, 1, inflow)over() )*1.0/inflow as diff, from_unixtime(window_time) from (select sum(inflow)/(max(__time__)-min(__time__)) as inflow , __time__-__time__%60 as window_time from log group by window_time order by window_time limit 15)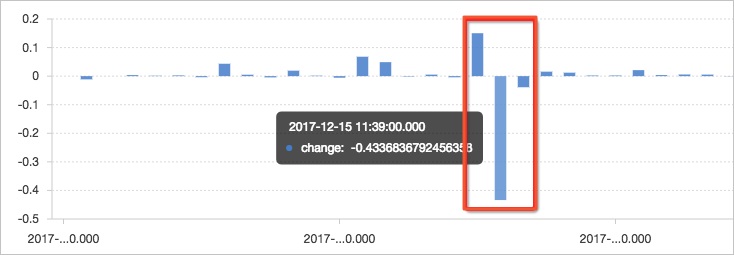
-
-