This topic describes how to collect user experience data from mini programs by using Simple Log Service SDK.
Prerequisites
A Full-stack Observability instance is created, and the version of the instance is 1.1.0 or later. For more information, see Create an instance.
Installation and initialization
In this topic, the data of WeChat mini programs is collected.
Log on to the Simple Log Service console.
In the Log Application section, click the Intelligent O&M tab. Then, click Full-stack Observability.
In the instance list, click the instance.
ImportantThe version of the instance must be 1.1.0 or later.
In the left-side navigation pane, choose .
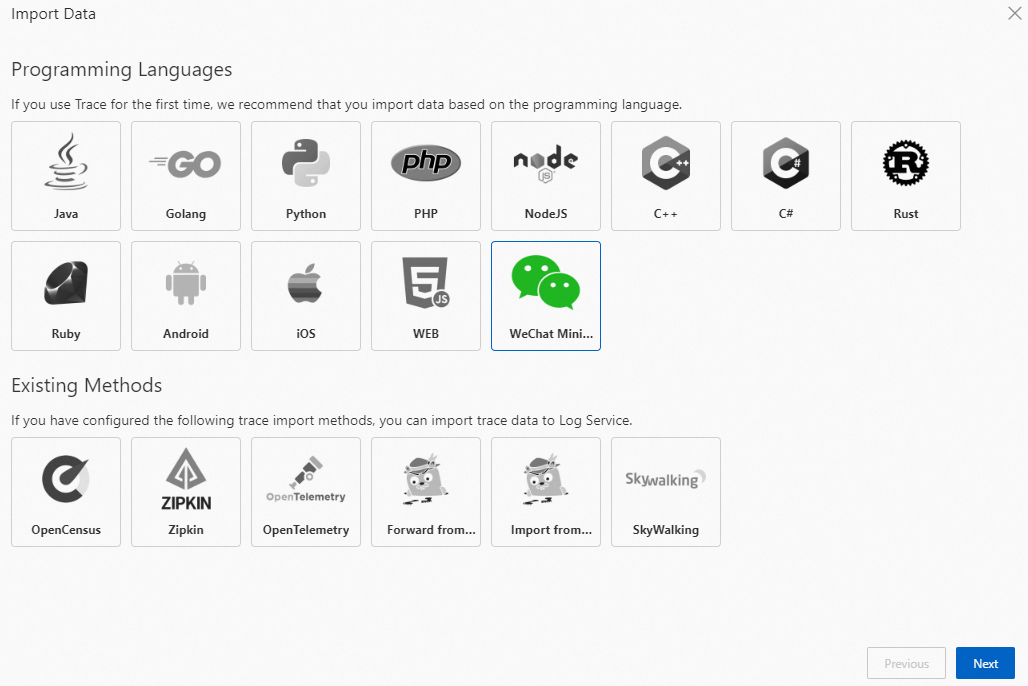
In the Import Data dialog box, perform the following operations:
Click WeChat Mini Program. Then, click Next.
Configure basic parameters.
Parameter
Description
Environment
After you specify environment information, the environment information is added to the user experience data that is collected from mini programs to an instance. You can specify a development, test, or integration environment. This helps you distinguish between user experience data that is collected from mini programs in different environments.
Service Name
After you specify the service name, the service information is added to the user experience data that is collected from mini programs to an instance. You can specify websites, workloads, or departments. This helps you to distinguish between user experience data that is collected from mini programs in different services.
Report Request Data
If you turn on Report Request Data, Simple Log Service SDK uploads API request data such as fetch and xhr.
Tracing Analysis
If you turn on Tracing Analysis, Simple Log Service SDK uploads the trace data of the frontend and backend.
After you complete the configurations, Simple Log Service generates the installation and initialization script.
Copy the preceding script to install and initialize Simple Log Service SDK.
You can install Simple Log Service SDK only by using npm.
Install an npm package.
npm install @aliyun-sls/web-trace-miniInitialize the SDK.
You can add other configuration items to SLS_TRACER. For more information, see Appendix 1: SLS_TRACER configuration items.
import { SLS_TRACER } from '@aliyun-sls/web-trace-mini';

SLS_TRACER.init({
  host: 'cn-beijing.log.aliyuncs.com',// The endpoint of the project that you specified when you created the instance.
  project: 'demo-test',// The project that you specified when you created the instance.
  logstore: 'demo-test-raw', // The name of the Logstore. After the instance is created, Simple Log Service automatically creates a Logstore named {instance}-raw.
  workspace: 'demo-test',// The name of the workspace. Enter the instance ID.
  env:  'prod',// The custom environment.
  service:  'miniprogram',// The name of the service.
  enableRequest:  true,// Upload API request data.
  enableTrace:  true // Enable trace monitoring.
})
After Simple Log Service SDK is installed and initialized, access your test mini program to generate test data.
Return to the Full-stack Observability application in the Simple Log Service console.
In the Import Data dialog box, click Next.
In the Checking data... step of the Import Data dialog box, click Checking data....
After you confirm that the data is valid, click Complete.
Upload custom events
SLS_TRACER SDK supports automatic monitoring of specific events and allows you to upload logs.
The SLS_TRACER.addLog() interface is used to upload custom events. This interface supports nested JSON data and allows you to specify a parameter in the JSON format. You can use a query statement to query and analyze uploaded data in Simple Log Service. The following sample code provides an example on how to call the SLS_TRACER.addLog() interface:
  SLS_TRACER.addLog({
    key: 'value',
    number: 1,
    array: [],
    json: {
      json: 'json'
    }
  })
Perform the rolling update of parameters
In some scenarios, you may not immediately obtain some user parameters such as uid. SLS_TRACER SDK allows you to dynamically configure the parameters after SLS_TRACER SDK is initialized. The rolling update can be performed on the following parameters: uid, nickname, env, service, version, and custom. The following sample code provides an example on how to call the interface:
SLS_TRACER.setOptions({
  uid: 'uid',
  nickname: 'newnickname',
  env: 'newEnv',
  custom: {
    c: 'newCustom',
  },
  version: 'newVersion',
  service: 'newService',
})
Configure custom plug-ins
SLS_TRACER SDK allows you to modify data during data uploading.
// You must call the following interface before you initialize the SDK.
SLS_TRACER.use({
  name: 'myPlugin',
  run: function () {
    this.subscribe(
      '*', // Subscribe to all data sources. If you want to subscribe to custom events, set the value to an asterisk (*).
      (data, next) => {
        //
        //
        // Determine the data type based on data.otBase.t.
        //
        //

        next(data) // When new data is passed to the next processor, the next(data) method must be called. Otherwise, the system stops uploading the data.
      },
      0, // Specify the priority of custom plug-ins. The priority range is 0 to 99.
    )
  },
})

// The data type of the data.
export interface NotifyData<OT extends Partial<OTTrace>, Extra = Record<string, any> | undefined> {
  otBase: OT
  extra: Extra
}
Appendix 1: SLS_TRACER configuration items
Parameter | Type | Required | Example | Description |
project | string | Yes | 'my-project' | The project that you specified when you created the instance. |
host | string | Yes | 'cn-hangzhou.log.aliyuncs.com' | The endpoint of the project that you specified when you created the instance. For more information, see Endpoints. |
logstore | string | Yes | 'my-logstore-raw' | After the instance is created, Simple Log Service automatically creates a Logstore named {instance}-raw. {instance} specifies the instance ID. You must set this parameter to the name of the Logstore. |
workspace | string | Yes | 'my-workspace' | The name of the workspace. Enter the instance ID. |
uid | string | No | '123456' | The user ID. |
nickname | string | No | 'Alice' | The nickname of the user. |
env | string | No | 'prod' | The custom environment. |
service | string | No | 'miniprogram' | The name of the service. |
version | string | No | '1.0.0' | The version number. |
custom | Record<string, any> | No | { key: 'value' } | The custom parameter. This parameter is used to store the custom information of the mini program. You can specify a JSON object of any type. |
trackTimeThreshold | number | No | 5 | The interval at which data is sent. Unit: seconds. Default value: 2. The value 0 specifies that data is immediately sent. |
trackCountThreshold | number | No | 20 | The number of data entries that can be sent at a time. Default value: 10. |
enableTrace | boolean | No | true | Specifies whether to enable the trace feature. |
enableTraceRequestConfig | (((value: string) => boolean) | string | RegExp)[] | No | None | The request for which you want to enable the trace feature. This parameter is an array containing the type and URL of the request for which you want to enable the trace feature. |
customTraceHeaders | Record<string, string> | No | None | The trace header. This parameter is used to configure a custom trace header when you send a request. |
enableRequest | boolean | No | true | Specifies whether to upload the request data. |
ignoreRequestConfig | (((value: string, status: number) => boolean) | string | RegExp)[] | No | None | The request that does not need to be uploaded. This parameter is an array containing the type and URL of the request that does not need to be uploaded. |
enableRequestBodyConfig | IEnableTrackRequestBody | No | None | The request whose body needs to be recorded. This parameter is an object containing the type and URL of the request whose body needs to be recorded. |
enableRuntimeError | boolean | No | true | Specifies whether to upload the data of JavaScript errors. |
ignoreRuntimeErrorConfig | (((value: string) => boolean) | string | RegExp)[] | No | None | The error to ignore during the runtime. This parameter is an array containing the type of the error to ignore. |
enableResourceError | boolean | No | true | Specifies whether to upload the data of JavaScript resource errors. |
enableResourcePerf | boolean | No | true | Specifies whether to upload the performance data of resources such as js, css, image, audio, and video. |
ignoreResourceConfig | (((value: string) => boolean) | string | RegExp)[] | No | None | The request for which you want to ignore resources. This parameter is an array containing the type and URL of the resources that you want to ignore. |
enablePerf | boolean | No | true | Specifies whether to upload the performance data of page loading. |
enableConsoleLog | enum | No | 'warn' | The log level. Valid values: error, warn, log, info, debug, and false. If you set the value to info, only logs of the error, warn, and info levels are recorded. |
platformSDK | any | No | wx | The SDK for the mini program platform. You can leave this parameter empty for supported platforms. The following platforms are supported:
|
platformRequestName | string | No | request | The request name that is sent by the SDK for the mini program platform. If you use an SDK for WeChat mini programs, set the parameter to request. Default value: request or httpRequest. |
Appendix 2: Details of log fields
The log fields in user experience data of mini programs are similar to the log fields in user experience data of web pages. For more information, see Appendix 2: Details of log fields.