This topic describes how to collect user experience data from web pages by using Simple Log Service SDK.
Prerequisites
A Full-stack Observability instance is created, and the version of the instance is 1.1.0 or later. A Full-stack Observability instance is recommended. For more information, see Create an instance.
Installation and initialization
Log on to the Simple Log Service console.
In the Log Application section, click the Intelligent O&M tab. Then, click Full-stack Observability.
In the instance list, click the instance.
ImportantThe version of the instance must be 1.1.0 or later.
In the left-side navigation pane, choose .
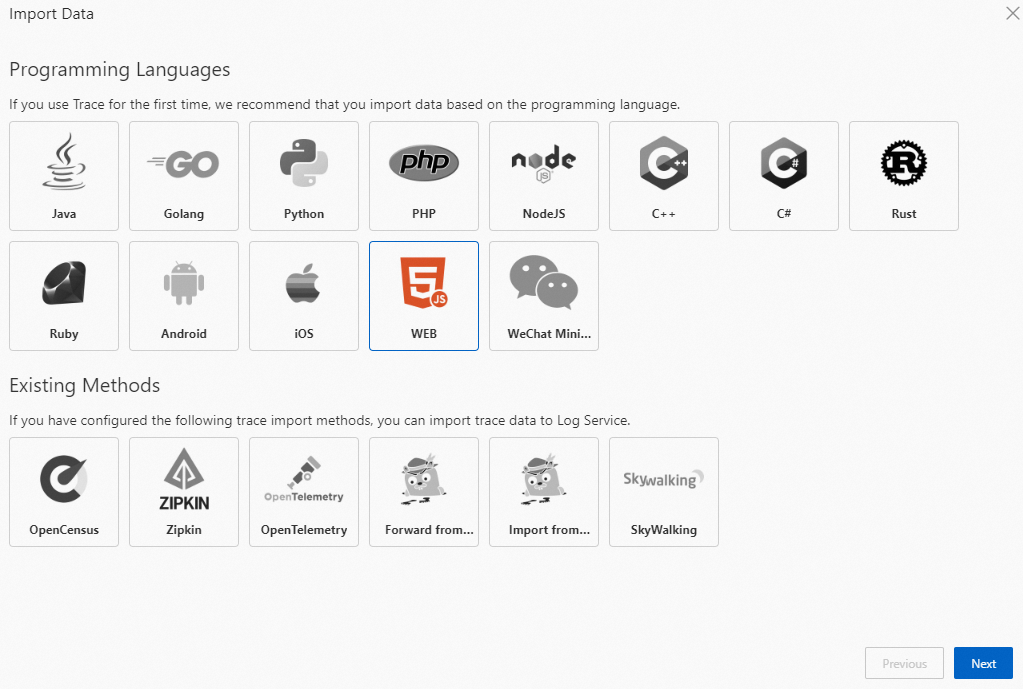
In the Import Data dialog box, perform the following operations:
Click WEB. Then, click Next.
Configure basic parameters.
Parameter
Description
Environment
After you specify environment information, the environment information is added to the user experience data that is collected from web pages to an instance. You can specify a development, test, or integration environment. This helps you distinguish between user experience data that is collected from web pages in different environments.
Service Name
After you specify the service name, the service information is added to the user experience data that is collected from web pages to an instance. You can specify websites, workloads, or departments. This helps you to distinguish between user experience data that is collected from web pages in different services.
Report Errors
If you turn on Report Errors, Simple Log Service SDK uploads the data of JavaScript errors and resource loading errors.
Report Resource Performance Data
If you turn on Report Resource Performance Data, Simple Log Service SDK uploads the performance data of resources such as js, css, image, audio, and video.
Report Request Data
If you turn on Report Request Data, Simple Log Service SDK uploads API request data such as fetch and xhr.
Report Page Loading Performance
If you turn on Report Page Loading Performance, Simple Log Service SDK uploads the performance data of page loading.
Tracing Analysis
If you turn on Tracing Analysis, Simple Log Service SDK uploads the trace data of the frontend and backend.
After you complete the configurations, Simple Log Service generates the installation and initialization script.
Copy the preceding script to install and initialize Simple Log Service SDK.
You can add other configuration items to SLS_CLIENT. For more information, see Appendix 1: SLS_CLIENT configuration items.
Install an npm package.
npm install @aliyun-sls/web-browserInitialize the SDK.
import { SLS_CLIENT } from '@aliyun-sls/web-browser'; SLS_CLIENT.init({ host: 'cn-beijing.log.aliyuncs.com', // The endpoint of the project that you specified when you created the instance. project: 'demo-test',// The project that you specified when you created the instance. logstore: 'demo-test-raw', // The name of the Logstore. After the instance is created, Simple Log Service automatically creates a Logstore named {instance}-raw. workspace: 'demo',// The name of the workspace. Enter the instance ID. env: 'prod',// The custom environment. service: 'web',// The name of the service. enableRuntimeError: true,// Upload the data of JavaScript errors and resource loading errors. enableResourcePerf: true, // Upload the performance data of resources. enableRequest: true,// Upload API request data. enablePerf: true,// Upload the performance data of page loading. enableTrace: true // Upload the trace data of the frontend and backend. })Access your test website to generate test data.
Return to the Full-stack Observability application in the Simple Log Service console.
In the Import Data dialog box, click Next.
In the Checking data... step of the Import Data dialog box, click Checking data....
After you confirm that the data is valid, click Complete.
CDN-based synchronous mode
Add the following code to the <head></head> tag on the HTML pages and make sure that the tag is added before all scripts.
In the following code, ${version} specifies the version number. The version number displayed in the Simple Log Service console shall prevail.
<script src="https://g.alicdn.com/sls/sls-js-sdk/0.3.0/web-browser.js"></script>
<script>
  window.SLS_CLIENT &&
    SLS_CLIENT.init({
      host: 'cn-beijing.log.aliyuncs.com', // The endpoint of the project that you specified when you created the instance.
      project: 'demo-test', // The project that you specified when you created the instance.
      logstore: 'demo-test-raw', // The name of the Logstore. After the instance is created, Simple Log Service automatically creates a Logstore named {instance}-raw.
      workspace: 'demo', // The name of the workspace. Enter the instance ID.
      env:  'prod', // The custom environment.
      service:  'web', //The name of the service.
      enableRuntimeError:  true, // Upload the data of JavaScript errors and resource loading errors.
      enableResourcePerf:  true, // Upload the performance data of resources.
      enableRequest:  true, // Upload API request data.
      enablePerf:  true, // Upload the performance data of page uploading.
      enableTrace:  true // Upload the trace data of the frontend and backend.
    })
</script>
CDN-based asynchronous mode
Add the following code to the <head></head> tag on the HTML pages and make sure that the tag is added before all scripts.
In the following code, ${version} specifies the version number. The version number displayed in the Simple Log Service console shall prevail.
<script>
    (function (h, o, u, n, d) {
      h=h[d]=h[d]||{p:[],e:[],q:[],
      addLog:function(log){h.p.push(log)},
      addError:function(log){h.e.push(log)},
      onReady:function(c){h.q.push(c)},};
      d=o.createElement(u);
      d.async=1;d.src=n;
      n=o.getElementsByTagName(u)[0];
      n.parentNode.insertBefore(d,n)
    })(window, document, 'script',
      'https://g.alicdn.com/sls/sls-js-sdk/0.3.0/web-browser.js', 'SLS_CLIENT')
  SLS_CLIENT.onReady(function () {
    SLS_CLIENT.init({
      host: 'cn-beijing.log.aliyuncs.com', // The endpoint of the project that you specified when you created the instance.
      project: 'demo-test', // The project that you specified when you created the instance.
      logstore: 'demo-test-raw', // The name of the Logstore. After the instance is created, Simple Log Service automatically creates a Logstore named {instance}-raw.
      workspace: 'demo', // The name of the workspace. Enter the instance ID.
      env:  'prod', // The custom environment.
      service:  'web', // The name of the service.
      enableRuntimeError:  true, // Upload the data of JavaScript errors and resource loading errors.
      enableResourcePerf:  true, // Upload the performance data of resources.
      enableRequest:  true, // Upload API request data.
      enablePerf:  true, // Upload the performance data of page uploading.
      enableTrace:  true // Upload the trace data of the frontend and backend.
    })
  })
</script>
npm method
Upload custom events
SLS_CLIENT SDK supports automatic monitoring of specific events and allows you to upload logs.
Upload custom logs
The SLS_CLIENT.addLog() interface is used to upload custom events. This interface supports nested JSON data and allows you to specify a parameter in the JSON format. You can use a query statement to query and analyze uploaded data in Simple Log Service. Example:
  SLS_CLIENT.addLog({
    key: 'value',
    number: 1,
    array: [],
    json: {
      json: 'json'
    }
  })
Upload the data of custom JavaScript errors
You can use the SLS_CLIENT.addError() interface to upload the data of custom JavaScript errors. Example:
SLS_CLIENT.addError(new Error('init error'))You can manually capture errors and upload the data of errors by calling the SLS_CLIENT.addError() interface. Example:
try {

} catch (err) {
  SLS_CLIENT.addError(err)
}
SLS_CLIENT SDK ensures that the system can find the SLS_CLIENT.addLog() or SLS_CLIENT.addError() interface when you call SLS_CLIENT SDK because SLS_CLIENT SDK enables SDK initialization. However, we recommend that you do not directly call the SLS_CLIENT.addLog() or SLS_CLIENT.addError() interface. If you want to call the interfaces, we recommend that you wrap the interfaces with specific functions. Example:
export function myAddLog(log) {
  if (SLS_CLIENT.addLog) {
    SLS_CLIENT.addLog(log)
  }
}
Perform the rolling update of parameters
In some scenarios, you may not immediately obtain some user parameters such as uid. SLS_CLIENT SDK allows you to dynamically configure the parameters after SLS_CLIENT SDK is initialized. The rolling update can be performed on the following parameters: uid, nickname, env, service, version, and custom. The following sample code provides an example on how to call the interface:
SLS_CLIENT.setOptions({
  uid: 'uid',
  nickname: 'newnickname',
  env: 'newEnv',
  custom: {
    c: 'newCustom',
  },
  version: 'newVersion',
  service: 'newService',
})
Configure custom plug-ins
SLS_CLIENT SDK allows you to modify data during data uploading.
// You must call the following interface before you initialize the SDK.
SLS_CLIENT.use({
  name: 'myPlugin',
  run: function () {
    this.subscribe(
      '*', // Subscribe to all data sources. If you want to subscribe to custom events, set this parameter to an asterisk (*).
      (data, next) => {
        //
        //
        // Determine the data type based on data.otBase.t.
        //
        //

        next(data) // When new data is passed to the next processor, the next(data) method must be called. Otherwise, the system stops uploading the data.
      },
      0, // Specify the priority of custom plug-ins. The priority range is 0 to 99.
    )
  },
})

// The data type of the data.
// For more information about log formats, see Appendix 2.
export interface NotifyData<OT extends Partial<OTTrace>, Extra = Record<string, any> | undefined> {
  otBase: OT
  extra: Extra
}
Appendix 1: SLS_CLIENT configuration items
Parameter | Type | Required | Example | Description |
project | string | Yes | 'my-project' | The project that you specified when you created the instance. |
host | string | Yes | 'cn-hangzhou.log.aliyuncs.com' | The endpoint of the project that you specified when you created the instance. For more information, see Public Simple Log Service endpoints. |
logstore | string | Yes | 'my-logstore' | After the instance is created, Simple Log Service automatically creates a Logstore named {instance}-raw. {instance} specifies the instance ID. You must set this parameter to the name of the Logstore. |
workspace | string | Yes | 'my-workspace' | The name of the workspace. Enter the instance ID. |
uid | string | No | '123456' | The user ID. |
nickname | string | No | 'Alice' | The nickname of the user. |
env | string | No | 'prod' | The custom environment. |
service | string | No | 'web' | The name of the service. |
version | string | No | '1.0.0' | The version number. |
custom | Record<string, any> | No | { key: 'value' } | The custom parameter. This parameter is used to store the custom information of the web page. You can specify a JSON object of any type. |
trackTimeThreshold | number | No | 5 | The interval at which data is sent. Unit: seconds. Default value: 2. The value 0 specifies that data is immediately sent. |
trackCountThreshold | number | No | 20 | The number of data entries that can be sent at a time. Default value: 10.
|
enableTrace | boolean | No | true | Specifies whether to enable the trace feature. |
enableTraceRequestConfig | (((value: string) => boolean) | string | RegExp)[] | No | None | The request for which you want to enable the trace feature. This parameter is an array containing the type and URL of the request for which you want to enable the trace feature. |
customTraceHeaders | Record<string, string> | No | None | The trace header. This parameter is used to configure a custom trace header when you send a request. |
enableRequest | boolean | No | true | Specifies whether to upload the request data. |
ignoreRequestConfig | (((value: string, status: number) => boolean) | string | RegExp)[] | No | None | The request that does not need to be uploaded. This parameter is an array containing the type and URL of the request that does not need to be uploaded. |
enableRequestBodyConfig | IEnableTrackRequestBody | No | None | The request whose body needs to be recorded. This parameter is an object containing the type and URL of the request whose body needs to be recorded. |
enableRuntimeError | boolean | No | true | Specifies whether to upload the data of JavaScript errors. |
ignoreRuntimeErrorConfig | (((value: string) => boolean) | string | RegExp)[] | No | None | The error to ignore during the runtime. This parameter is an array containing the type of the error to ignore. |
enableResourceError | boolean | No | true | Specifies whether to upload the data of JavaScript resource errors. |
enableResourcePerf | boolean | No | true | Specifies whether to upload the performance data of resources such as js, css, image, audio, and video. |
ignoreResourceConfig | (((value: string) => boolean) | string | RegExp)[] | No | None | The request for which you want to ignore resources. This parameter is an array containing the type and URL of the resources that you want to ignore. |
enablePerf | boolean | No | true | Specifies whether to upload the performance data of page loading. |
enableConsoleLog | enum | No | 'warn' | The log level. Valid values: error, warn, log, info, debug, and false. If you set this parameter to info, only logs of the error, warn, and info levels are recorded. |
enableDomClick | boolean | No | true | Specifies whether to record user-click events. Default value: true. |
Appendix 2: Details of log fields
OpenTelemetry basic fields
Field | Type | Description |
duration | long | The duration. Unit: microseconds. |
start | long | The start time. The value is a UNIX timestamp. |
end | long | The end time. The value is a UNIX timestamp. |
kind | long | The type of the operation. |
name | text | The name of the operation. |
service | text | The name of the service. |
spanID | text | The unique identifier of the operation. |
statusCode | text | The status code. |
statusMessage | text | The status message. |
traceID | text | The unique identifier of the trace operation. |
attribute | json | The attribute information. For more information, see the attribute field. |
resource | json | The resource information. For more information, see the resource field. |
attribute field
Field | Type | Description |
pid | text | The ID of the page. |
sid | text | The ID of the session. |
t | text | The data type. For more information, see attribute.t data types. |
uid | text | The user ID. Simple Log Service SDK automatically generates a user ID and collects statistics on page views (PVs) and unique visitors (UVs). User IDs do not have specific business attributes. Therefore, UVs cannot be accurately counted based on user IDs. |
version | text | The custom software version. |
client_ip | text | The IP address of the client that uploads data. |
receive_time | long | The time when the data is received. |
attribute.t data types
Type | Description |
error | The error that occurs during JavaScript runtime. |
log | The custom log. |
pv | The PV data, which is uploaded when a page is accessed or a route is switched. |
api | The API request data. |
res | The resource request data. |
res_err | The error data of the failed resource request. |
perf | The performance data. |
console | The console data. |
resource field
Field | Type | Description |
browser.name | text | The name of the browser that initiates the request. |
browser.screen | text | The resolution of the browser window. |
browser.version | text | The version of the browser that initiates the request. |
device.screen | text | The device resolution. |
os.name | text | The operating system that initiates the request. |
os.type | text | The type of the operating system. |
os.version | text | The version of the operating system. |
user_agent.original | text | The browser user_agent. |
workspace | text | The workspace, which corresponds to the instance ID. |
deployment.environment | text | The custom environment. |
uem.data.type | text | The type of the data related to user experience monitoring. |
uem.sdk.version | text | The version of the SDK used for user experience monitoring. |
uem.miniprogram.platform | text | The mini program platform used for user experience monitoring. |
device.model.name | text | The device name of the mini program used for user experience monitoring. |
Page information
Field | Type | Description |
page.host | text | The host of the page. |
page.referrer | text | The source information about the page after encoding. |
page.referrer_original | text | The source page. |
page.target | text | The URL of the page after encoding. |
page.target_original | text | The URL of the page. |
Request information
Field | Type | Description |
http.host | text | The address of the server that initiates the request. |
http.method | text | The method of the request. |
http.scheme | text | The protocol of the request. |
http.status_code | text | The status code. |
http.url | text | The URL of the request. |
Geographic information
Field | Type | Description |
isp | text | The Internet service provider (ISP) of the client. |
province | text | The province where the client resides. |
province_id | text | The code of the province where the client resides. |
city | text | The city where the client resides. |
city_id | text | The code of the city where the client resides. |
country | text | The country where the client resides. |
country_id | text | The code of the country where the client resides. |
Resource information
Field | Type | Description |
resource.id | text | The random ID of the resource. |
resource.type | text | The type of the resource. |
resource.url | text | The URL of the resource. |
JavaScript error information
Field | Type | Description |
ex.stacktrace | text | The error stack. |
ex.message | text | The error message. |
ex.type | text | The type of the error. |
ex.id | text | The random ID of the error. |
ex.col | text | The column number of the error. |
ex.line | text | The line number of the error. |
ex.file | text | The file in which the error occurs. |
Performance information
Field | Type | Description |
perf.dcl | long | The timestamp when DOMContentLoaded is triggered. |
perf.di | long | The timestamp of the first interaction. |
perf.dns | text | The duration of Domain Name System (DNS) resolution. |
perf.duration | long | The duration of page loading. |
perf.fcp | long | The duration of the first contentful paint. |
perf.fid | long | The latency of the first input. |
perf.fit | long | The duration taken for a web page to become fully interactive. |
perf.fp | textlong | The duration of the first paint. |
perf.lcp | long | The maximum duration of a contentful paint. |
perf.load | long | The timestamp when page loading is complete. |
perf.red | text | The duration of redirection. |
perf.size | long | The size of the page. |
perf.ssl | text | The duration of the SSL handshake. |
perf.tcp | text | The duration of the TCP connection. |
perf.trans | text | The duration of transmission. |
perf.ttfb | text | The time when the browser starts to receive the response data from the server. |