This topic describes how to configure a flame graph to display analytical data.
Background information
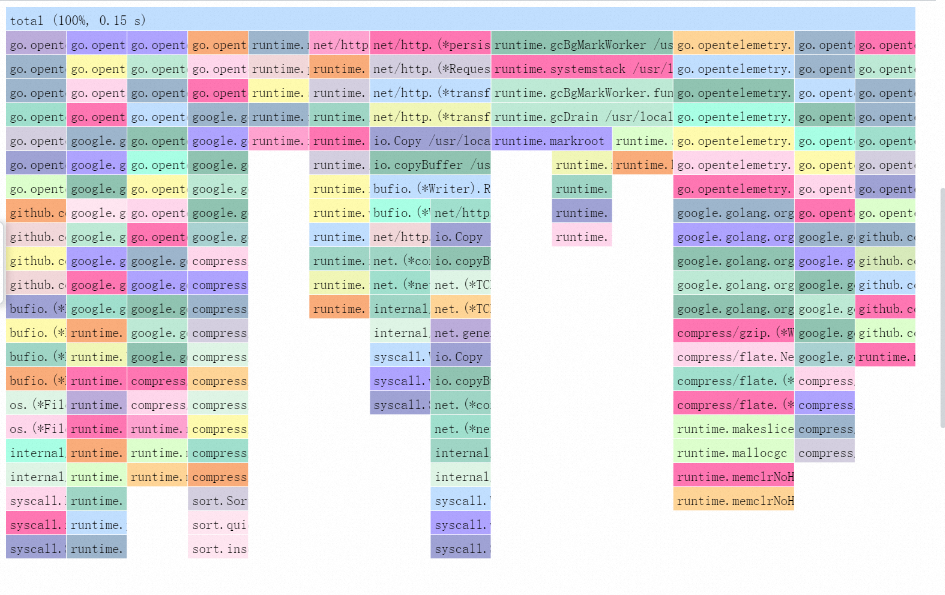
A flame graph is used to visualize the performance analysis data of software. Developers can use flame graphs to identify the performance bottlenecks of code and obtain the call relationships and call duration between different functions or code blocks in the code. In a flame graph, a rectangle indicates a method or a function, the width of the rectangle indicates the percentage of the method or function execution time in the total execution time, and the height of the rectangle indicates the depth of the method or function in the call stack. The stacked methods or functions are in the nested relationships.
Procedure
You can add a flame graph on the Data Query or Data Comparison page. For more information, see Data query and Data comparison.
Configurations on the Common Settings tab
On the Common Settings tab, you can configure global settings for the flame graph.
Parameters in the Basic Configurations section
Parameter
Description
Title
The title of the flame graph.
Show Title
If you turn on Show Title, the title of the flame graph is displayed.
Show Border
If you turn on Show Border, the borders of the flame graph are displayed.
Show Background
If you turn on Show Background, the background color of the flame graph is displayed.
Show Time
If you turn on Show Time, the query time range of the flame graph is displayed.
Fixed Time
If you turn on Fixed Time, the specified query time range remains unchanged regardless of whether the global time range of the dashboard changes.
Parameters in the Flame Graph Configurations section
Parameter
Description
Display Mode
The display mode of the flame graph. Valid values:
Only Flame Graph: displays only the flame graph.
Only Table: displays only the table.
Table + Flame Graph: displays the table and flame graph.
Table Retrieval Feature
If the table is displayed and Table Retrieval Feature is turned on, Simple Log Service dynamically adjusts the content of the table and flame graph based on your input.
Interaction with the flame graph
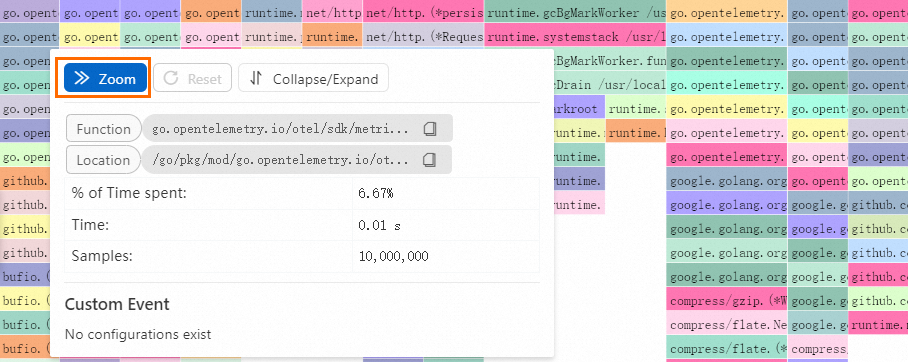
You can click a rectangle in the flame graph to interact with the flame graph. You can zoom in, collapse, expand, or reset the fire graph. You can sort, extend, or retrieve the table. You can also highlight specific rectangles, copy method names and locations, and view value details.
Zoom in the flame graph
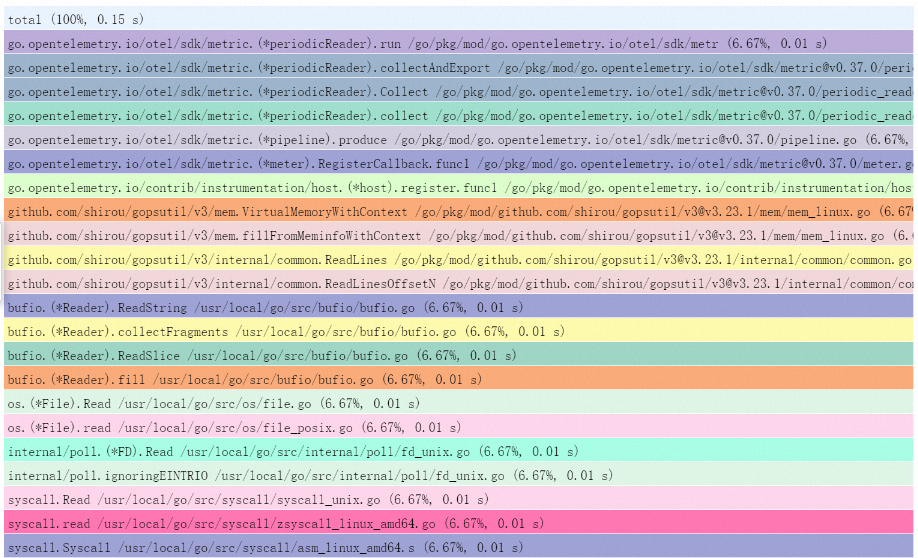
Click Zoom to expand the width of the selected rectangle to 100%. This allows you to focus on the context of the stack where the method or function resides.
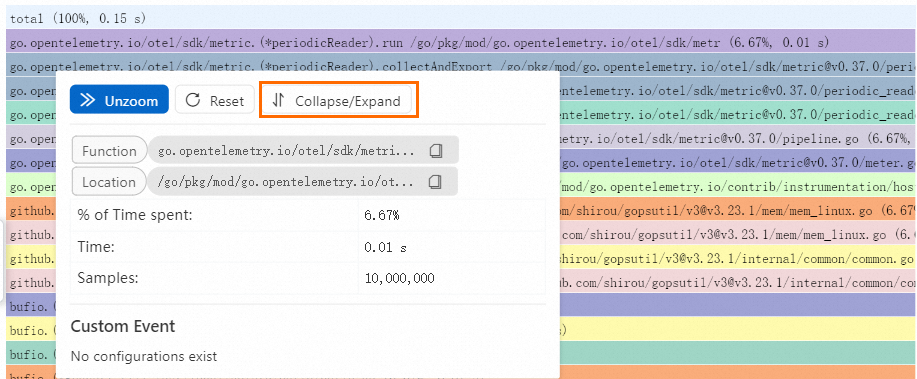
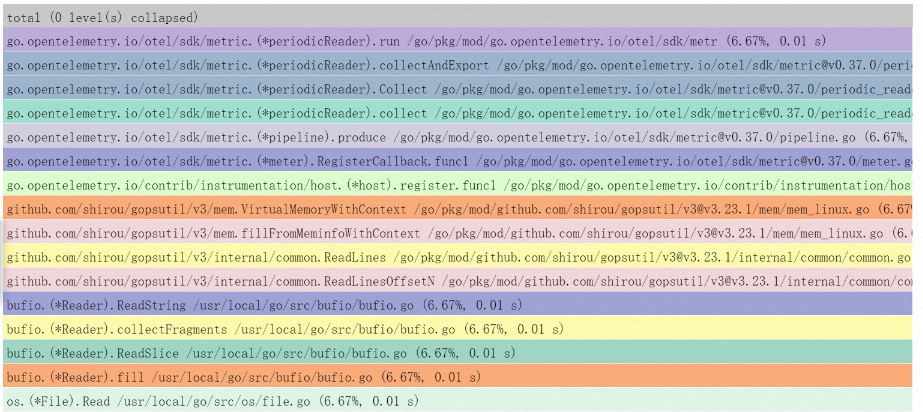
Collapse or expand the flame graph
Click Collapse/Expand to collapse or expand the stack bottom. This feature is suitable for scenarios in which the stack depth is large and the stack bottom can be ignored.
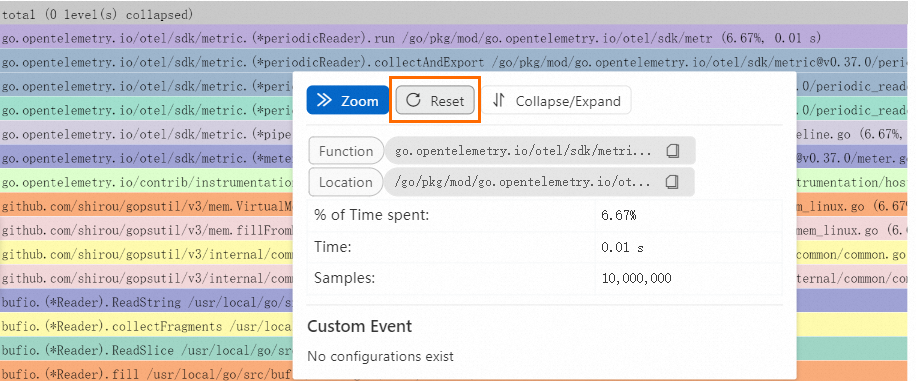
Reset the flame graph
If you want to restore the flame graph to the original view, click Reset.
Copy method names and locations
Click the
 icon of a method or location to copy the method name or location.
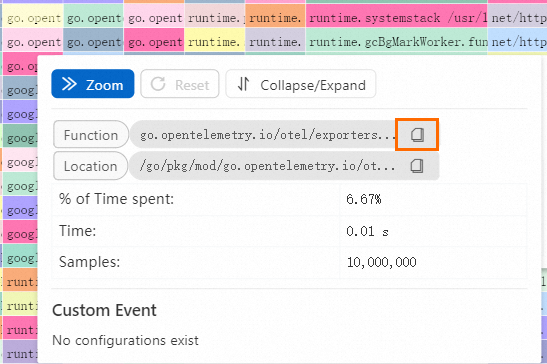
View value details
Click or move the pointer over a cell in the table or a rectangle in the flame graph to view the details of the corresponding values.
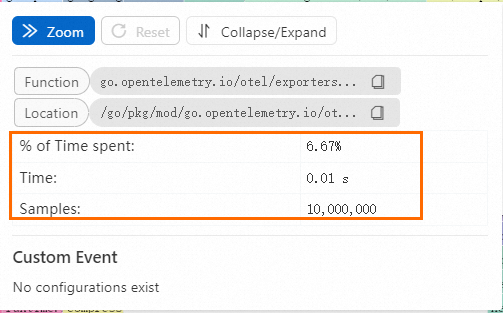
The following table describes the value units.
Category
Unit recorded in data
Unit displayed in the flame graph
Time
nanoseconds and lock_nanoseconds
s (second), m (minute), h (hour), d (day), M (month), and Y (year)
Bytes
bytes and inuse_space
bytes, KB, MB, GB, TB, and PB
Quantity
objects, goroutines, exceptions, and count
Null, K (10^3), M (10^6), B (10^9), T (10^12), and P (10^15)
View mode
The view mode of the flame graph includes the data query view and data comparison view.
Data query view
Table
Table header
Description
Function + Location
The method name and location. The header corresponds to the
namefield in performance monitoring data.Self
The exclusive resource usage of the method, excluding child methods.
Total
The resource usage of the method, including child methods.
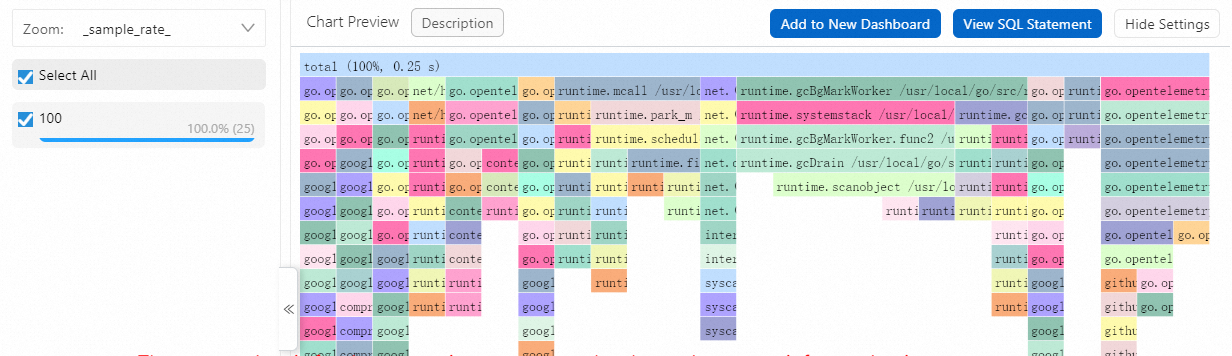
Flame graph
The length and percentage of a rectangle in the flame graph are determined by Self and Total. The color of a rectangle in the flame graph is determined by the hash value of Function + Location.
Data comparison view
Table
Table header
Description
Function + Location
The method name and location. The header corresponds to the
namefield in performance monitoring data.Prior
The ratio of the total size of the method to the value of the total method during the previous period of time.
Current
The ratio of the total size of the method to the value of the total method during the current period of time.
Diff
The difference between Current and Prior.
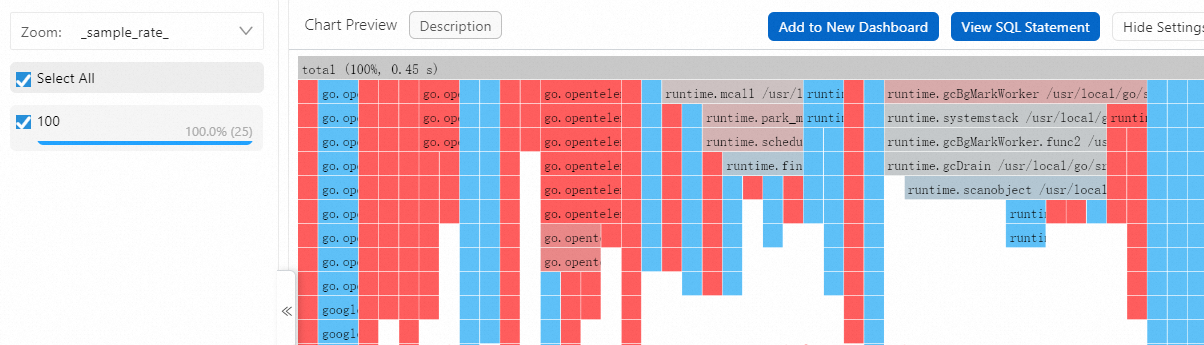
Flame graph
The length and percentage of a rectangle in the flame graph are determined by Self and Total. The color of a rectangle in the flame graph is determined by Diff. The larger the absolute value of Diff is, the more vivid the color is.
Interaction occurrences
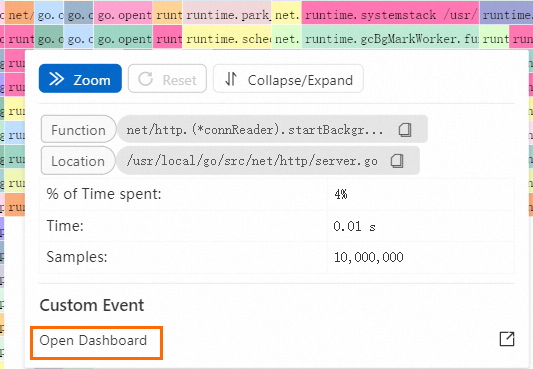
You can configure interaction occurrences in the flame graph to perform drill-down analysis on stacks. This helps you gain a deeper insight into data. You can configure the following interaction occurrences: Open Logstore, Open Saved Search, Open Dashboard, Open Trace Analysis, Open Trace Details, and Create Custom HTTP URL. For more information, see Interaction occurrences.
By default, interaction occurrences are configured for Query Statement A. For example, you can configure the Open Dashboard interaction occurrence for the flame graph. After you configure the settings, click a point in the flame graph and then click Open Dashboard. You are redirected to the specified dashboard.
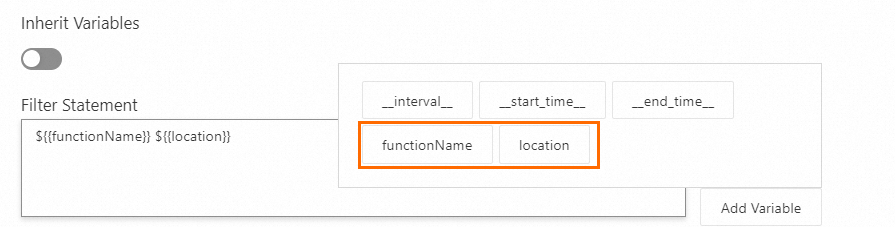
When you configure an interaction occurrence, you can add functionName and location as variables to the Filter Statement field. Then, if you click a value of Method + Location in the table or a rectangle in the flame graph, the clicked method name and location are used as the filter condition of the interaction occurrence.