After you collect performance monitoring data to the Full-stack Monitoring application, you can go to the Data Comparison page to view the value changes of a profile within different time ranges.
Prerequisites
Performance monitoring data is collected. For more information, see Collect performance monitoring data from Pyroscope.
Background information
After performance monitoring data is collected, it is stored in a Logstore named ${Instance ID}-profile. Performance monitoring data is the source for Profile Explorer. You can use Profile Explorer to view profile information and compare profile changes in an efficient manner.
Entry point
Log on to the Simple Log Service console.
On the Intelligent O&M tab of the Log Application section, click Full-stack Monitoring.
On the Full-stack Monitoring page, click the instance that you want to manage.
In the left-side navigation pane, choose Performance Monitoring > Data Comparison.
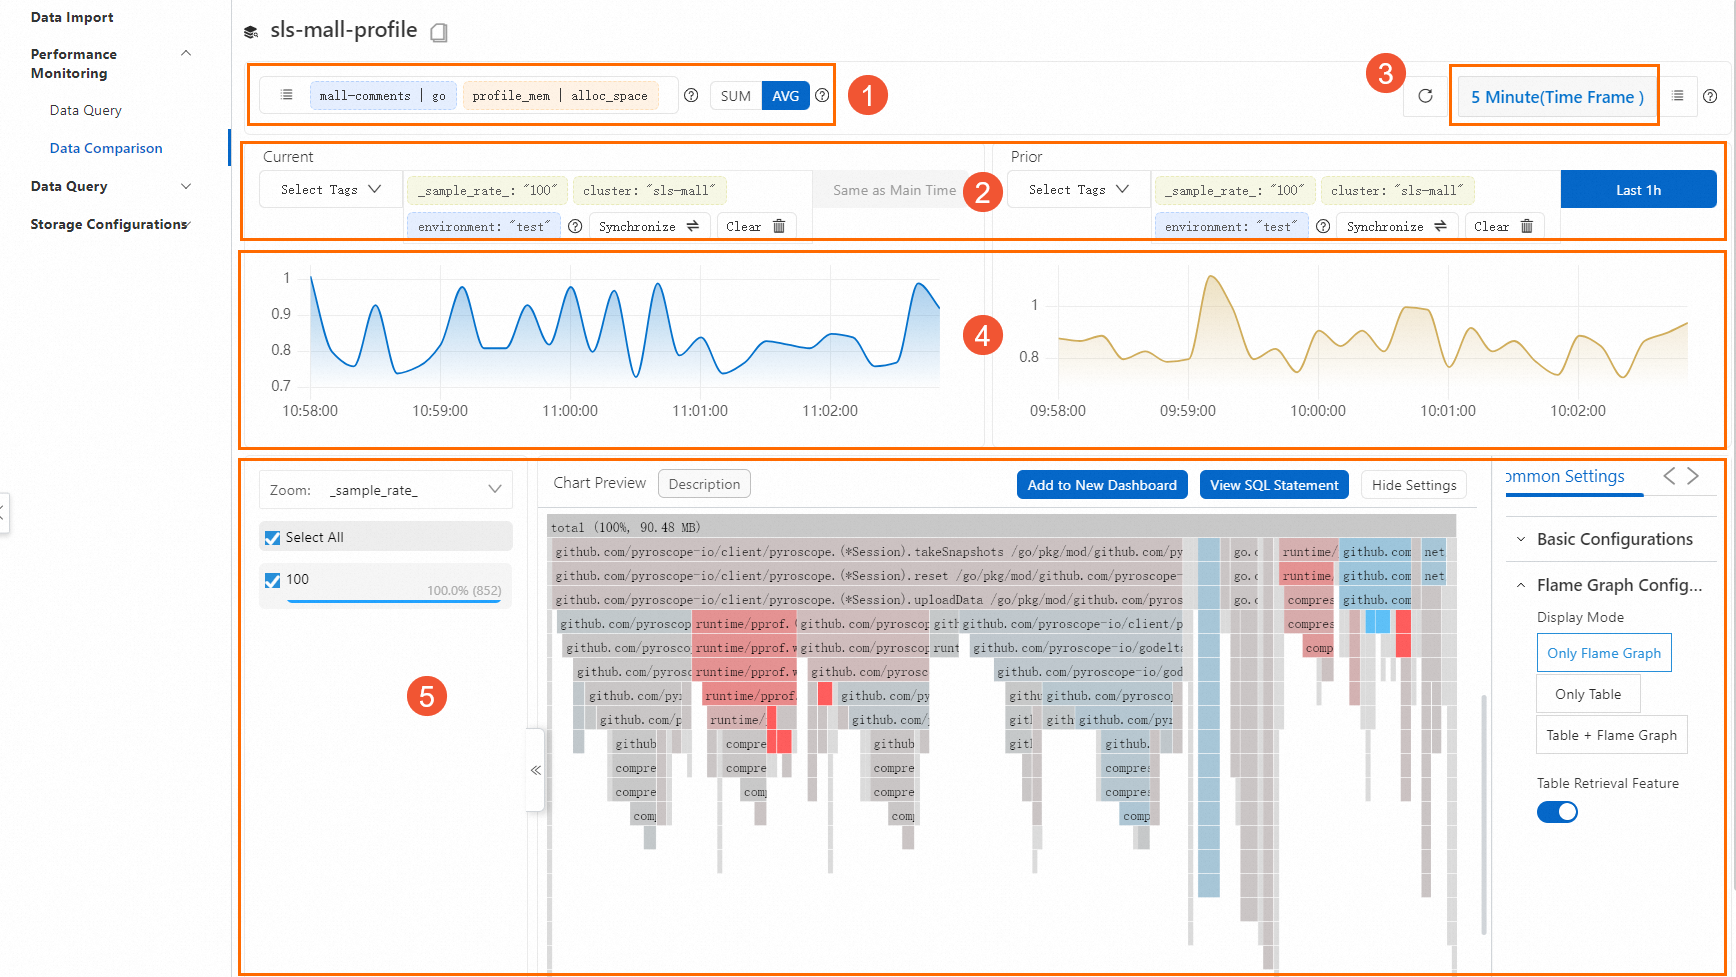
Section
Description
1
Filter by metadata.
Tags, sparklines, and flame graphs depend on profile metadata.
2
Select tags.
3
Specify a main time range.
4
View a sparkline.
5
View a flame graph.
Filter by metadata
Profile metadata consists of the service, language, type, and valueTypes fields. The service field corresponds to the labels.__name__ field in performance monitoring data. Other fields correspond to the same-name fields in performance monitoring data. You can use the four fields to uniquely identify a group of profiles. For more information, see Format of performance monitoring data.
In Section 1, you can perform the following operations:
Specify the time range of metadata
If you specify the time range of metadata, the time range of tags is also specified. The default value is the previous 15 minutes. This helps ensure the response speed. In most cases, you do not need to change the value. If data frequently changes or is generated at large intervals, you can click the
 icon to adjust the time range.
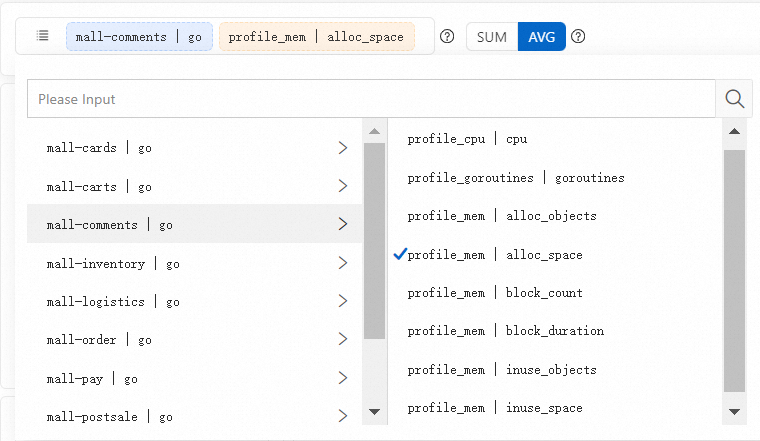
 Search metadata
You can search metadata from the following dimensions:
service,language,type, andvalueTypes. In addition,unit-based search is supported.Select metadata
After you select a set of metadata-related items, the system automatically updates the sparklines and flame graph based on the selected metadata.
ImportantIf you select different items, the system deletes existing tags in the Select Tags field and specifies All Tags.
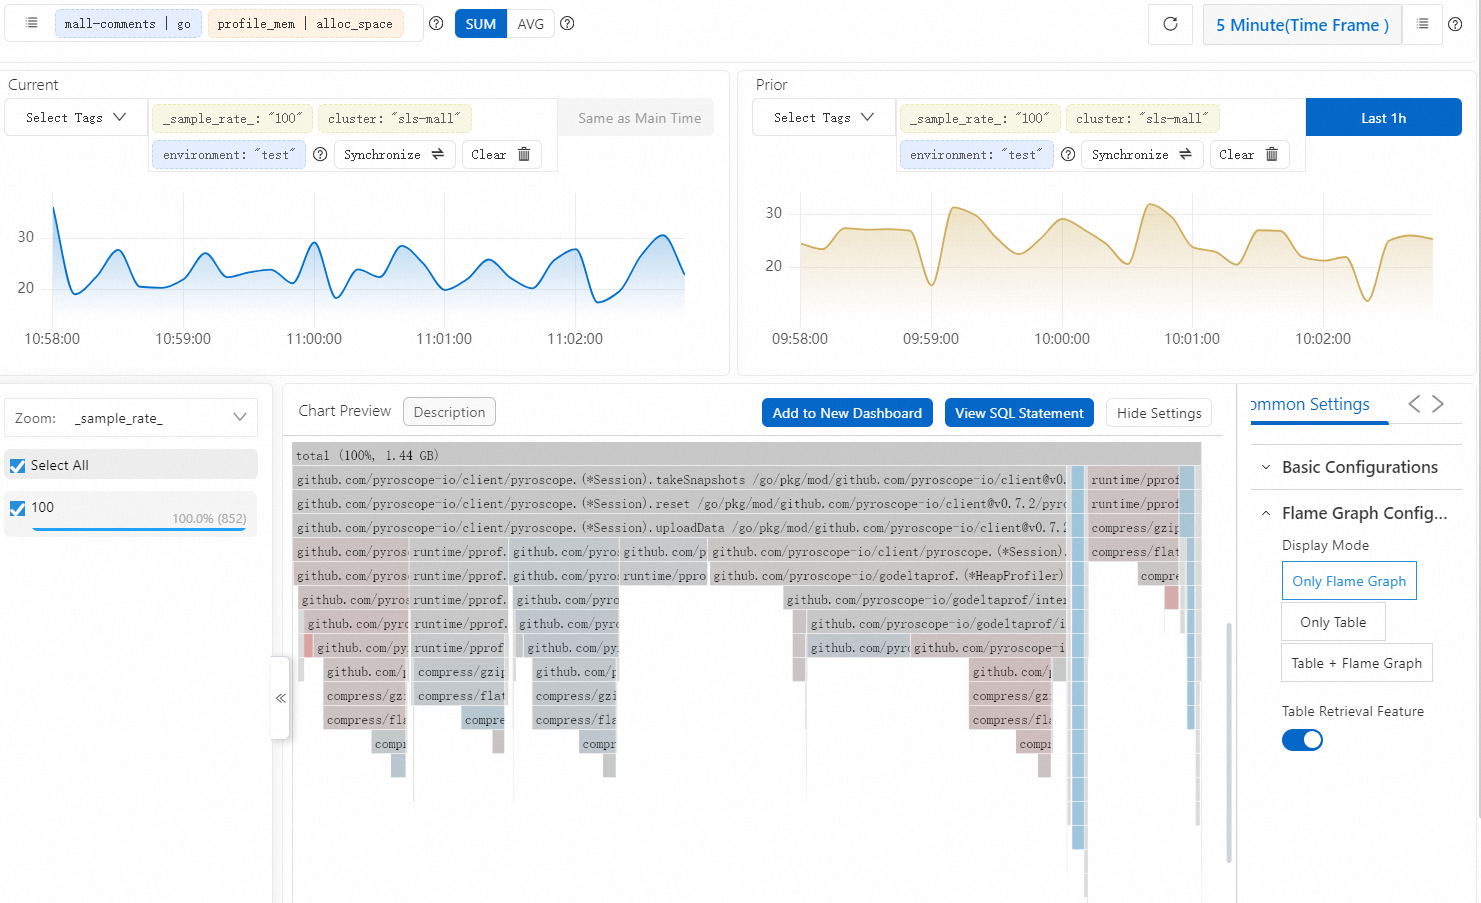
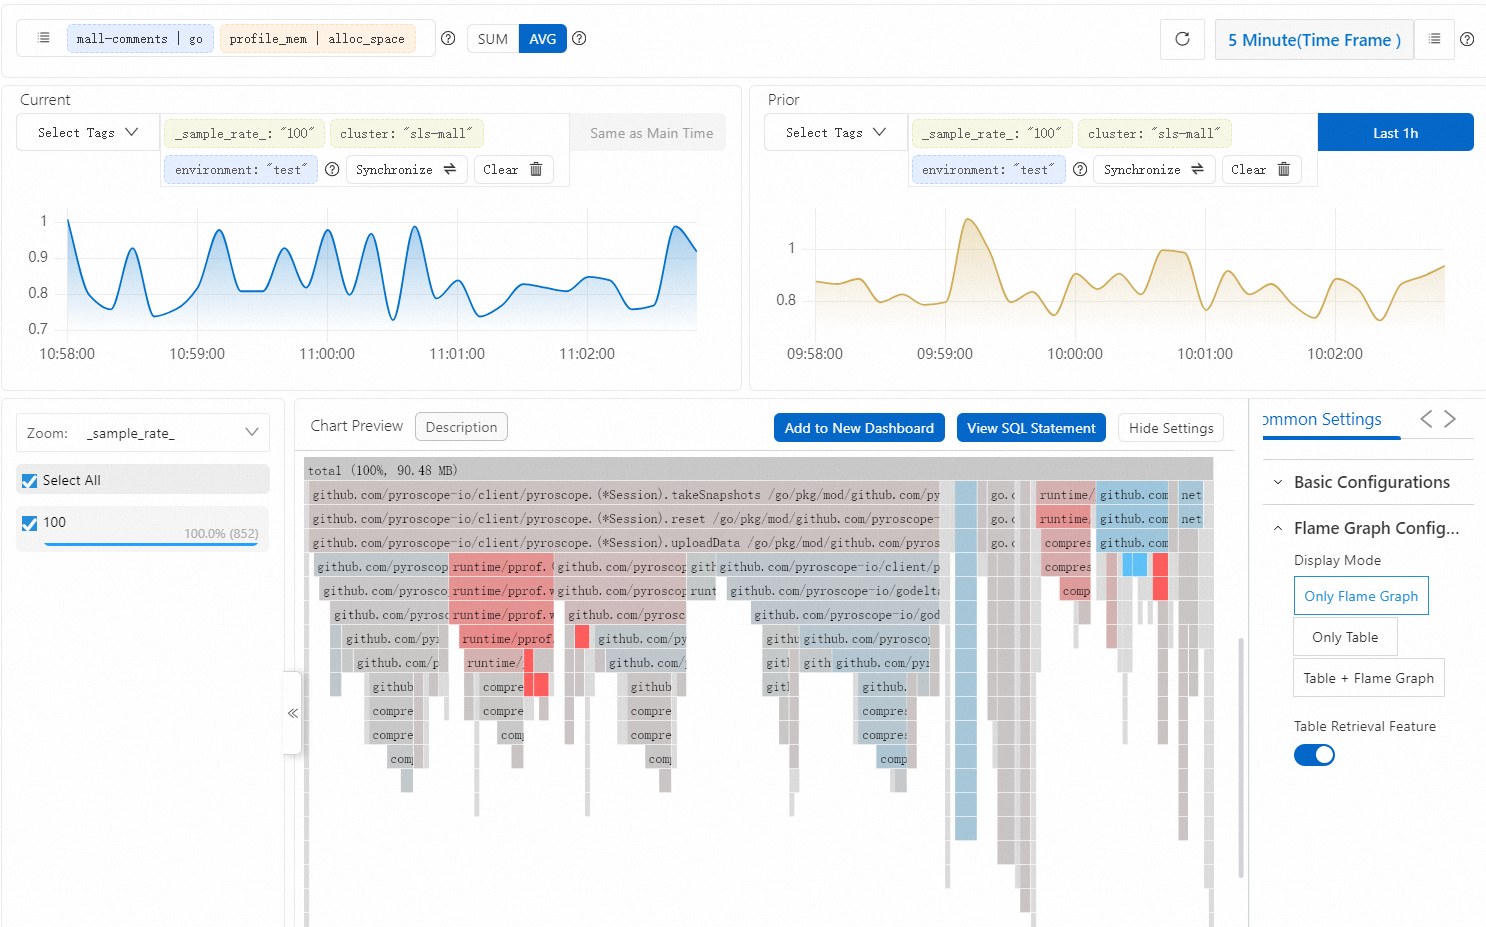
Configure an aggregation policy
The system supports SUM and AVG aggregation policies. The sparklines and flame graph both depend on the aggregation policy that you configure.
If you configure a SUM aggregation policy, data in a flame graph is aggregated based on the stackID field. The values indicate the total resources consumed by the profiles that are collected within the specified main time range. The flame graph shows the overall resource usage by different methods within the main time range.
If you configure an AVG aggregation policy, data in a flame graph is aggregated based on the stackID field. The values indicate the average resources consumed by the collected profiles. The flame graph shows the average resource usage by different methods.
Select tags
The tags that you can select vary based on the time range of metadata. A tag key is derived from the labels field in performance monitoring data. The field is in the JSON format. Each tag supports the IN and NOT IN operators for filtering. Different tags are evaluated by using a logical AND. After you select tags, the system automatically updates the sparklines and flame graph based on the selected tags.
You can select automatically displayed tags or manually enter tags.
The tags that are automatically displayed vary based on the time range of metadata. In most cases, you need to only manage automatically displayed tags.
If tags are not generated within the time range of metadata, you can click Add to enter the tags.
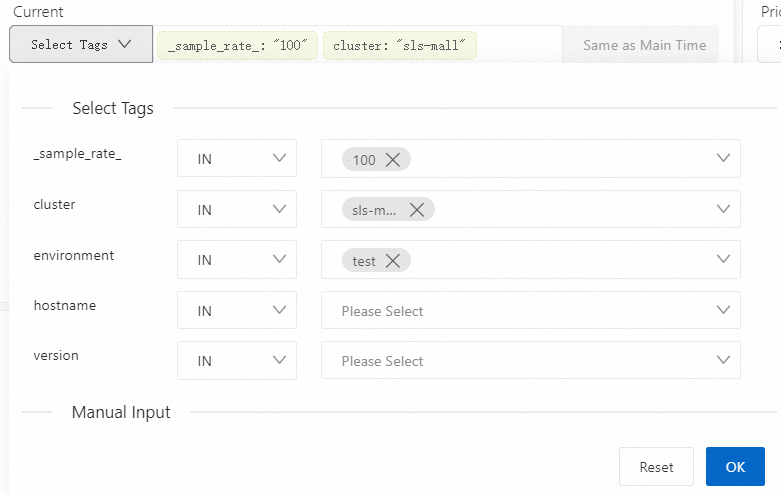
In Section 2, you can select tags for current values and historical values. After you select tags, you can also perform the following operations:
Click Reset to reset tag settings. After you click OK, the tag settings take effect. The system automatically updates the sparklines and flame graph.
Click Clear to delete the selected tags. The system automatically updates the sparklines and flame graph.
Click Synchronize to synchronize tag settings between current values and historical values.
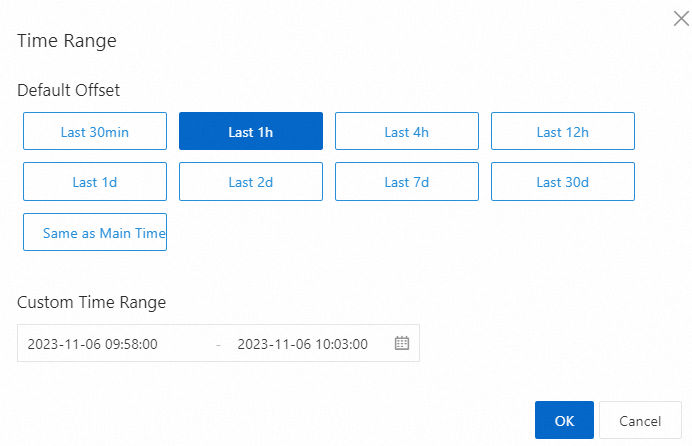
Specify a main time range
The main time range takes effect only for the sparklines and flame graph. The time range of metadata is not affected.
Sparkline
A sparkline displays the fluctuation and general trend of data within different time ranges. A sparkline is generated based on the results of metadata- and tag-based filtering. The data is aggregated by time. You can configure an aggregation policy in Section 1. For more information about the values in a sparkline, see Flame graph.
In the Current section, the time range is fixed and is the same as the main time range. In the Prior section, you can specify a different time range for comparison.
Flame graph
After you select metadata, tags, and a time range for comparison, the system automatically generates a flame graph for the obtained profiles. For more information, see Flame graph.
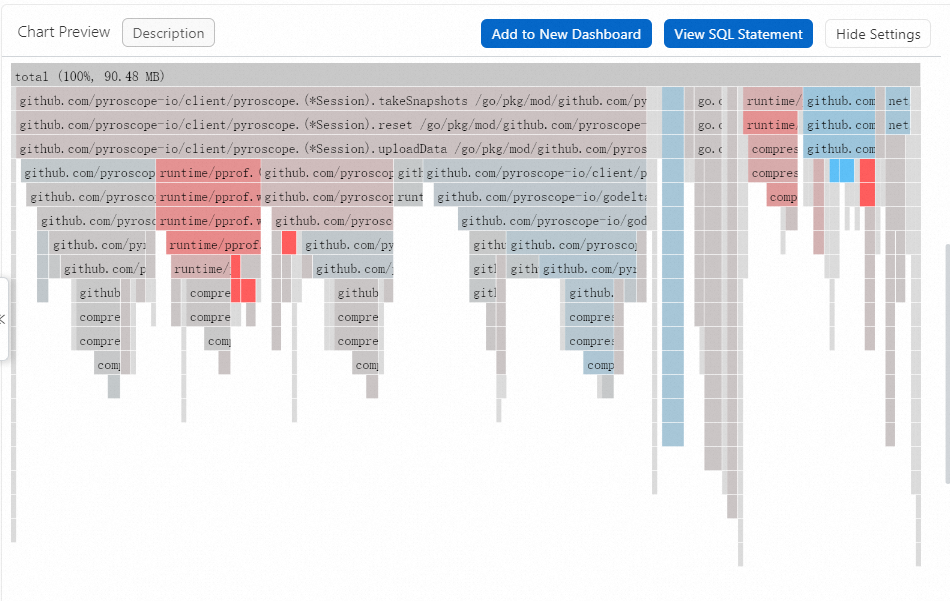
In Section 5, you can perform the following operations:
Add a chart to a dashboard
A dashboard displays real-time data analysis results. You can click Add to New Dashboard to save a flame graph as a chart on a dashboard.
View SQL statements
You can view the SQL statement that is used to generate a flame graph.