Docker events include all interactive events of objects such as containers, images, plug-ins, networks, and volumes. This topic describes how to configure Logtail in the Simple Log Service console to collect Docker events.
Prerequisites
Logtail V0.16.18 or later is installed on a Linux server. For more information, see Install Logtail on a Linux server.
Limits
Logtail that runs on containers or hosts must be authorized to access the
/var/run/docker.sockfile.For information about how to use Logtail to collect Kubernetes logs, see Collect Kubernetes logs. For information about how to collect standard container logs, see Collect logs from standard Docker containers.
When Logtail is restarted or stopped, container events are not collected.
Scenarios
Monitor the start and stop events of all containers, and trigger alerts when core containers stop running.
Collect all container events for auditing, security analysis, and troubleshooting.
Monitor all image pulling events, and trigger an alert if an image is pulled from an invalid path.
Procedure
Log on to the Simple Log Service console.
In the Import Data section, select Custom Data Plug-in.
Select the project and Logstore. Then, click Next.
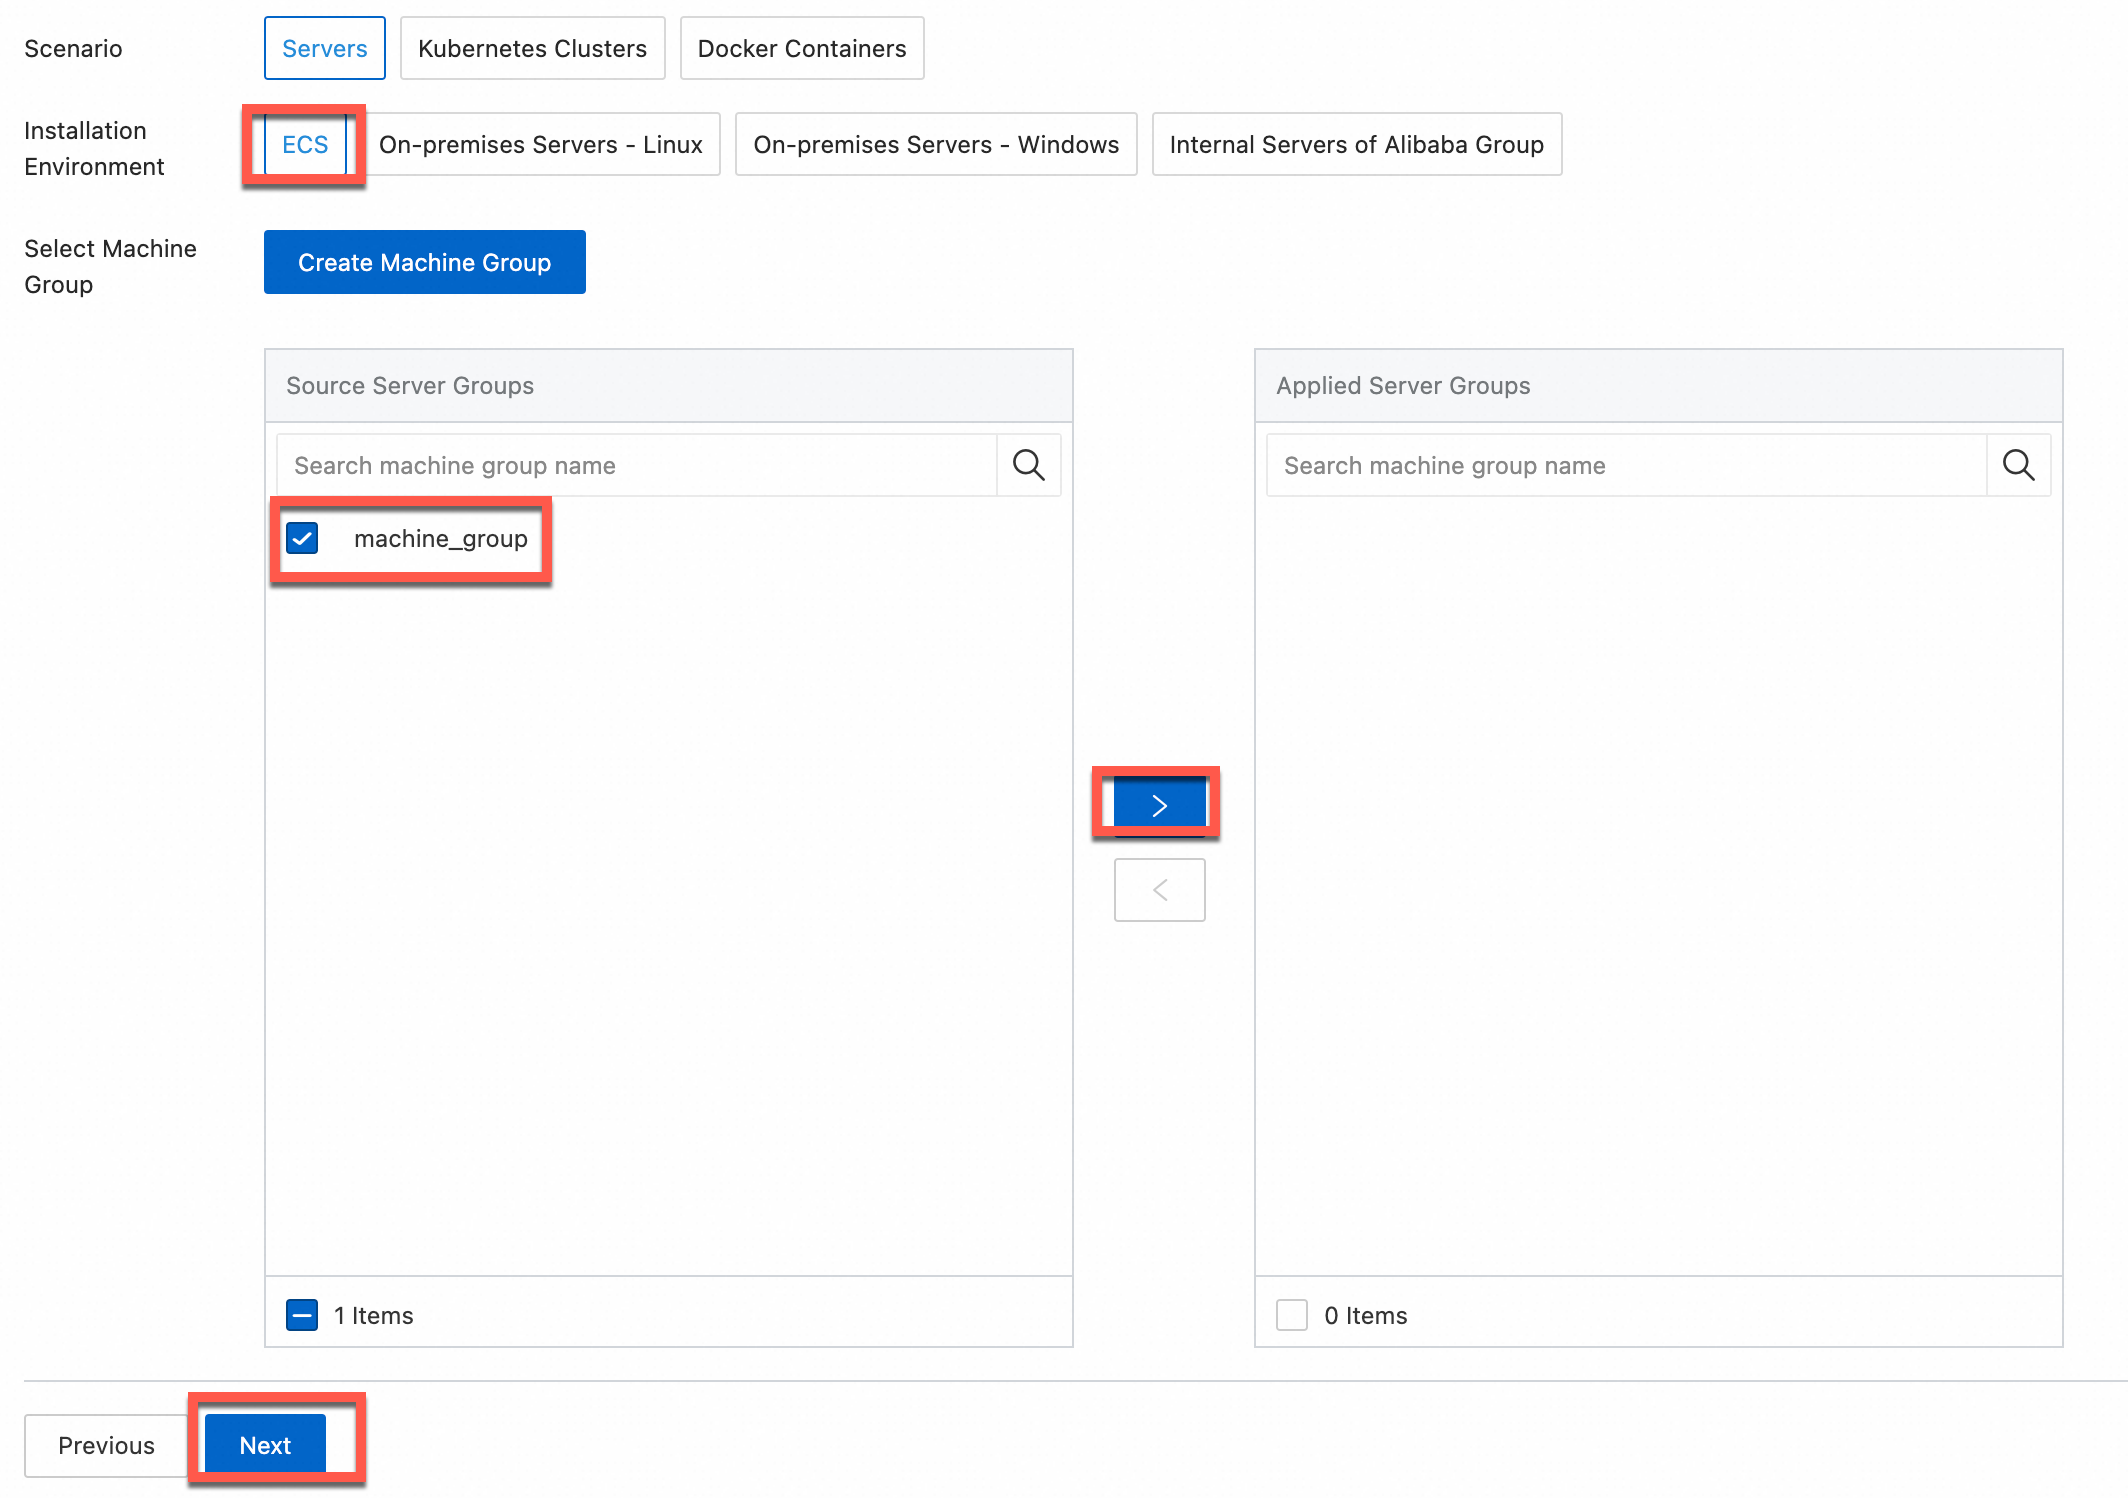
In the Machine Group Configurations step, configure a machine group.
Configure the Scenario and Installation Environment parameters based on your business requirements.
ImportantYou must configure the Scenario and Installation Environment parameters regardless of whether a machine group is available. The parameter settings affect subsequent configurations.
Make sure that a machine group is displayed in the Applied Server Groups section and click Next.
Machine group available
Select a machine group from the Source Machine Group section.
No machine group available
Click Create Machine Group. In the Create Machine Group panel, configure the parameters. You can set the Machine Group Identifier parameter to IP Address or Custom Identifier. For more information, see Create a custom identifier-based machine group or Create an IP address-based machine group.
ImportantIf you apply a machine group immediately after you create the machine group, the heartbeat status of the machine group may be FAIL. This issue occurs because the machine group is not connected to Simple Log Service. To resolve this issue, you can click Retry. If the issue persists, see What do I do if no heartbeat connections are detected on Logtail?
In the Configure Data Source step, set the Configuration Name and Plug-in Configuration parameters, and then click Next.
inputs is required and is used to configure the data source settings for the Logtail configuration.
ImportantYou can specify only one type of data source in inputs.
processors is optional and is used to configure the data processing settings for the Logtail configuration to parse data. You can specify one or more processing methods.
If your logs cannot be parsed based only on the setting of inputs, you can configure processors in the Plug-in Configuration field to add plug-ins for data processing. For example, you can extract fields, extract log time, mask data, and filter logs. For more information, see Use Logtail plug-ins to process data.
{
  "inputs": [
    {
      "detail": {},
      "type": "service_docker_event"
    }
  ]
}
Parameter
Type
Required
Description
type
string
Yes
The type of the data source. Set the value to service_docker_event.
EventQueueSize
int
No
The maximum number of events in the event queue. Default value: 10.
Create indexes and preview data. Then, click Next. By default, full-text indexing is enabled in Simple Log Service. You can also manually create field indexes for the collected logs or click Automatic Index Generation. Then, Simple Log Service generates field indexes. For more information, see Create indexes.
ImportantIf you want to query all fields in logs, we recommend that you use full-text indexes. If you want to query only specific fields, we recommend that you use field indexes. This helps reduce index traffic. If you want to analyze fields, you must create field indexes. You must include a SELECT statement in your query statement for analysis.
Click Log Query. You are redirected to the query and analysis page of your Logstore.
You must wait approximately 1 minute for the indexes to take effect. Then, you can view the collected logs on the Raw Logs tab. For more information, see Query and analyze logs.
Troubleshooting
If no data is displayed on the preview page or query page after logs are collected by using Logtail, you can troubleshoot the errors based on the instructions that are provided in What do I do if errors occur when I use Logtail to collect logs?
Sample logs
This section provides sample Docker events.
Example 1: image pulling event
__source__:  10.10.10.10
__tag__:__hostname__:  logtail-ds-77brr
__topic__:
_action_:  pull
_id_:  registry.cn-hangzhou.aliyuncs.com/ringtail/eventer:v1.6.1.3
_time_nano_:  1547910184047414271
_type_:  image
name:  registry.cn-hangzhou.aliyuncs.com/ringtail/eventer
Example 2: container destruction event in Kubernetes
__source__:  10.10.10.10
__tag__:__hostname__:  logtail-ds-xnvz2
__topic__:
_action_:  destroy
_id_:  af61340b0ac19e6f5f32be672d81a33fc4d3d247bf7dbd4d3b2c030b8bec4a03
_time_nano_:  1547968139380572119
_type_:  container
annotation.kubernetes.io/config.seen:  2019-01-20T15:03:03.114145184+08:00
annotation.kubernetes.io/config.source:  api
annotation.scheduler.alpha.kubernetes.io/critical-pod:
controller-revision-hash:  2630731929
image:  registry-vpc.cn-hangzhou.aliyuncs.com/acs/pause-amd64:3.0
io.kubernetes.container.name:  POD
io.kubernetes.docker.type:  podsandbox
io.kubernetes.pod.name:  logtail-ds-44jbg
io.kubernetes.pod.namespace:  kube-system
io.kubernetes.pod.uid:  6ddcf598-1c81-11e9-9ddf-00163e0c7cbe
k8s-app:  logtail-ds
kubernetes.io/cluster-service:  true
name:  k8s_POD_logtail-ds-44jbg_kube-system_6ddcf598-1c81-11e9-9ddf-00163e0c7cbe_0
pod-template-generation:  9
version:  v1.0
The following table describes the fields in a Docker event. For more information, see docker events.
Field | Description |
_type_ | The type of the resource. Example: container or image. |
_action_ | The type of the action. Example: destroy or status. |
_id_ | The unique ID of the event. |
_time_nano_ | The timestamp of the event. |