Log Service lets you analyze logs with SQL-92 query statements and visualize the results in various charts. This topic describes how to perform this analysis in the Log Service console.
Prerequisites
-
You have collected website logs. For more information, see Data Collection.
-
You have created an index. For more information, see Create Indexes.
Background
Website logs are a vital source of information for website operations and maintenance (O&M), providing metrics such as PV, UV, visitor location distribution, and the top 10 most visited pages. Log Service offers diverse log collection methods and a one-stop analysis solution. You can use the Query + SQL-92 syntax to analyze logs in real time and visualize the results in charts. Log Service also supports the creation of log analysis dashboards for various scenarios by using visualization tools such as its built-in dashboards, DataV, Grafana, Tableau (via a JDBC connection), and Quick BI.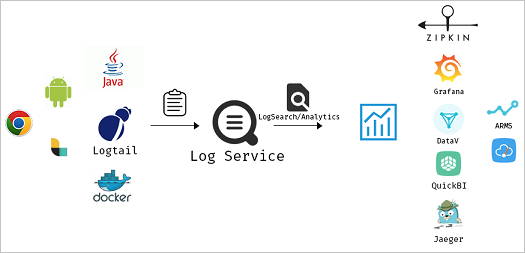
Procedure
Log on to the Simple Log Service console.
In the Projects section, click the one you want.

On the tab, click the logstore you want.

-
Enter a query statement, and then click Last 15 Minutes to set the time range.
For more information, see Step 1: Configure indexes.
-
View client access data from the last 24 hours in a table, sorted in descending order.
* | SELECT remote_addr, count(*) as count GROUP BY remote_addr ORDER BY count DESC -
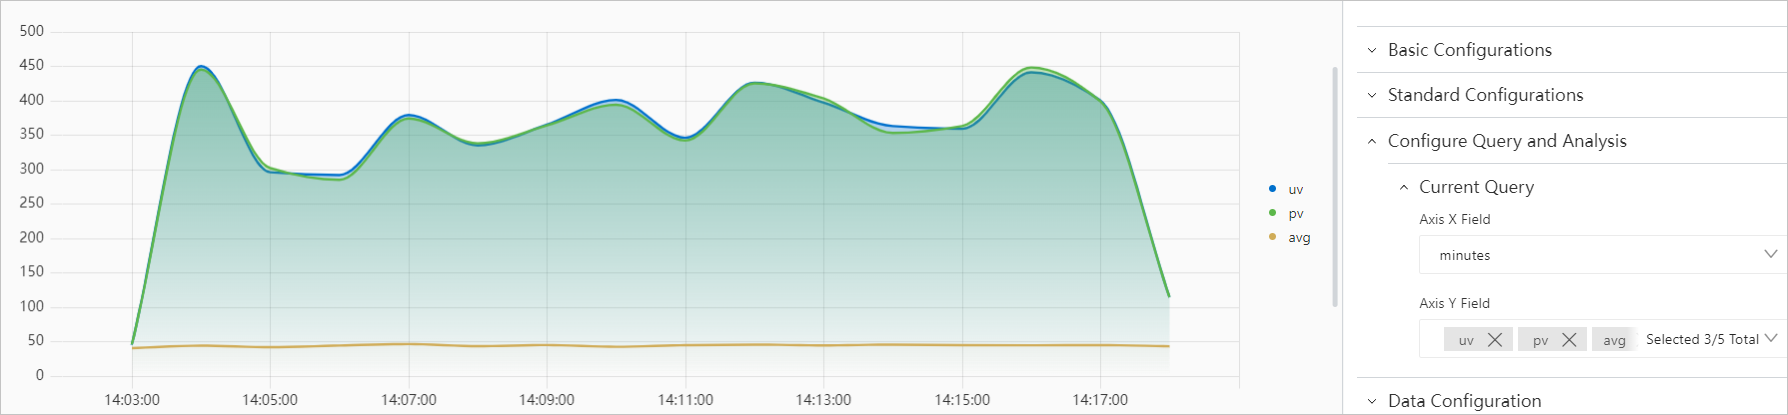
Use a line chart to view the trends of PVs, UVs, and average response time over the last 15 minutes.
* | select date_format(from_unixtime(__time__ - __time__% 60), '%H:%i:%S') as minutes, approx_distinct(remote_addr) as uv, count(1) as pv, avg(request_time) as avg group by minutes order by minutes asc limit 100000In the Query and Analysis Configurations section, set Axis X Field to minutes and Axis Y Field to pv, uv, and avg. The following chart is displayed.
-
Use a column chart to show the number of requests from referrers in the last 15 minutes.
* | select referer, count(1) as count group by referer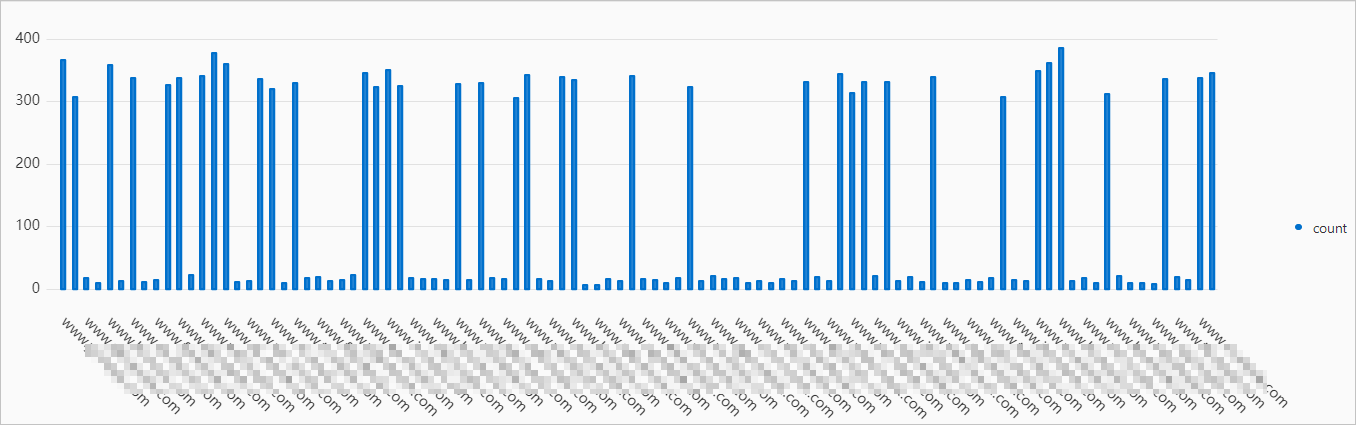
-
Use a bar chart to view the top 10 visited pages in the last 15 minutes.
* | select request_uri, count(1) as count group by request_uri order by count desc limit 10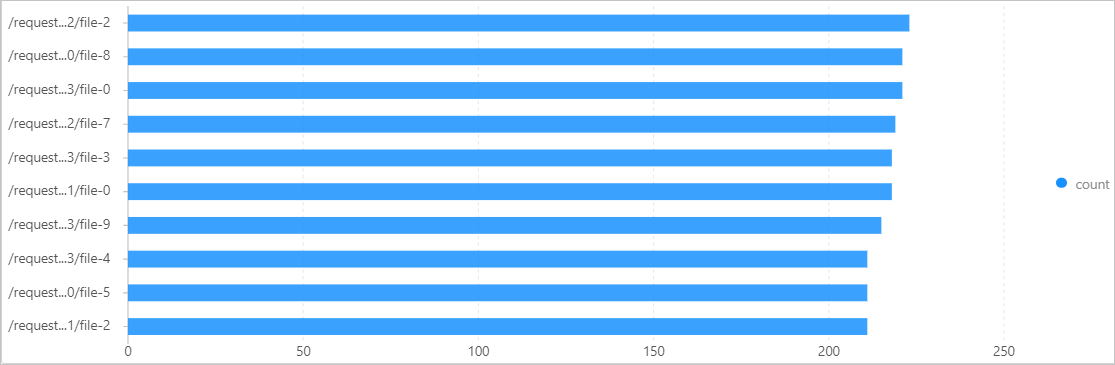
-
Use a pie chart to show the distribution of page visits in the last 15 minutes.
* | select request_uri as uri , count(1) as c group by uri limit 10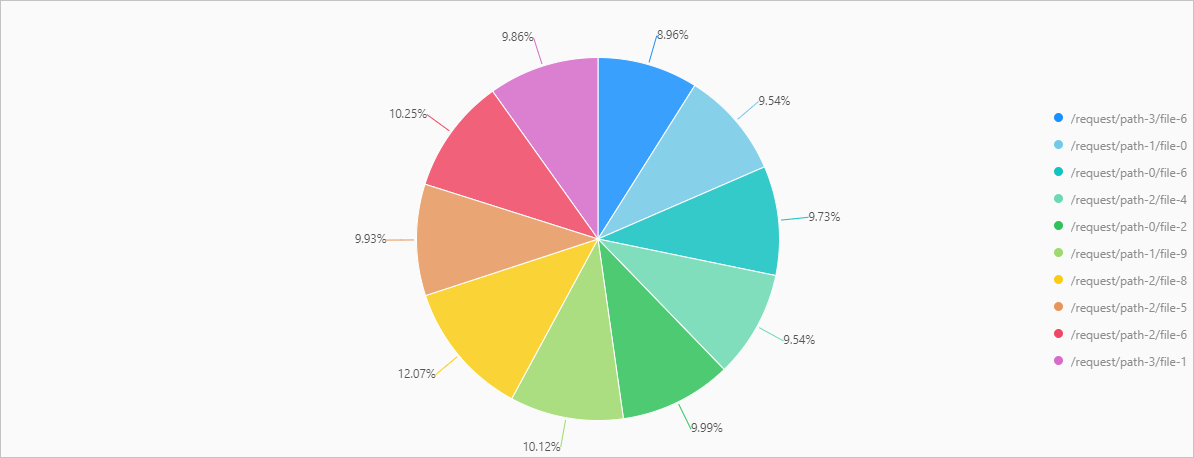
-
Use a single-value chart to display the total PV in the last 15 minutes.
* | select count(1) as PV
-
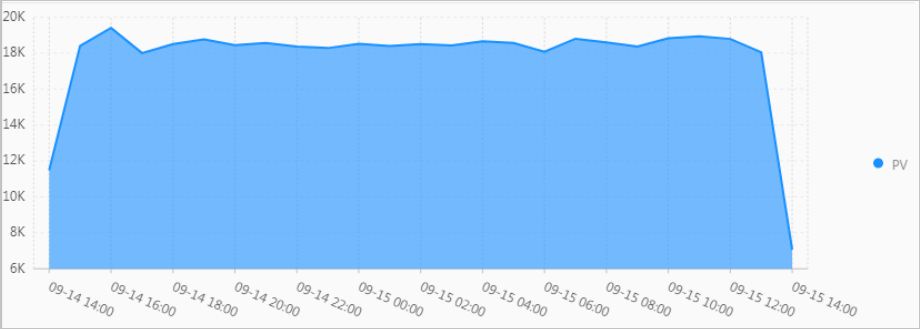
Use an area chart to view access data for a specific IP address over the last 24 hours.
remote_addr: 10.0.XX.XX | select date_format(date_trunc('hour', __time__), '%m-%d %H:%i') as time, count(1) as PV group by time order by time limit 1000Set Axis X to time and Axis Y to PV. The following chart is displayed.
-
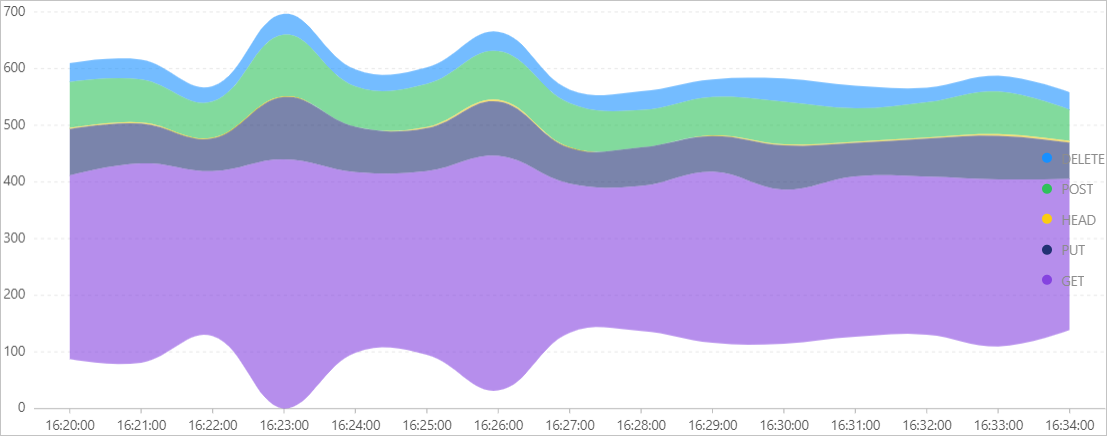
Use a stream chart to show how the request count for each method changes over the last 15 minutes.
* | select date_format(from_unixtime(__time__ - __time__% 60), '%H:%i:%S') as minute, count(1) as c, request_method group by minute, request_method order by minute asc limit 100000Set Axis X to minute, Axis Y to c, and Aggregate Column to request_method. The following chart is displayed.
-
-
Add the chart to a dashboard.
Click Add to New Dashboard. For more information, see Add a chart to a dashboard.