After NGINX access logs are collected to Simple Log Service, you can execute a query statement in Simple Log Service to query the numbers of page views (PVs) per minute. If you want to query the numbers of PVs per 10 seconds, 60 seconds, or 600 seconds, you must modify the query statement multiple times. To simplify operations, you can add a filter of the Variable Replacement type. This topic describes how to add a filter of the Variable Replacement type to query the numbers of PVs based on NGINX access logs.
Prerequisites
NGINX access logs are collected. For more information, see Collect text logs from servers.
Indexes are created. For more information, see Create indexes.
Procedure
The following figure shows the operations that you need to perform to add a filter of the Variable Replacement type.

Simple Log Service also supports adding filters of the Filter type and Metric Filter type. For more information, see Filter types.
Step 1: Query and analyze data
To query the numbers of PVs per minute by using a query statement, perform the following operations:
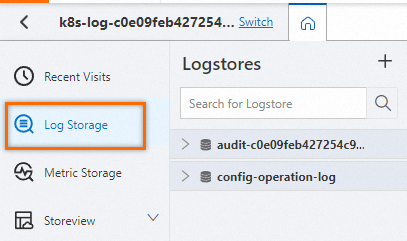
Log on to the Simple Log Service console.
In the Projects section, click the project that you want to manage.

On the tab, click the logstore that you want to manage.
Enter a query statement in the search box, click Last 15 Minutes, and then specify a query time range.
In this example, enter the following query statement to query the numbers of PVs per minute:
* | SELECT date_format(__time__ - __time__ % 60, '%H:%i:%s') as time, count(1) as count GROUP BY time ORDER BY timeThe query and analysis results are displayed in a chart.
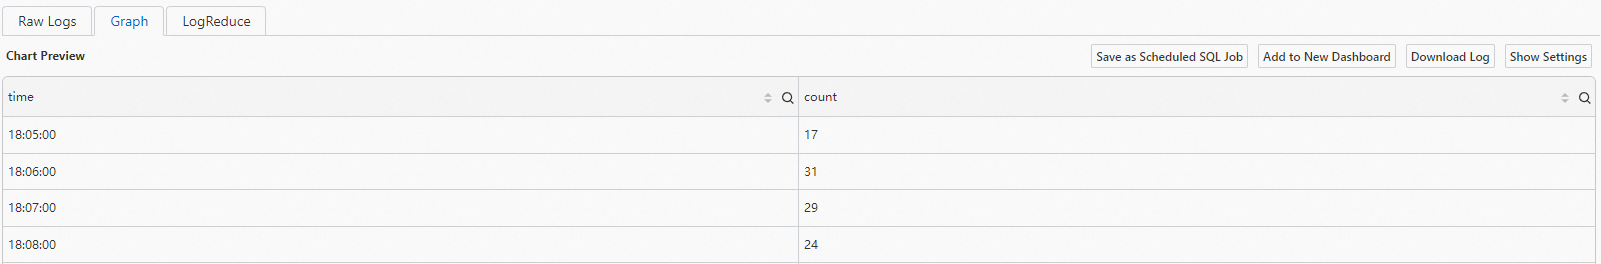
Step 2: Add the chart to a dashboard
To add the chart that displays the numbers of PVs per minute to the NGINX Access Log dashboard, perform the following operations:
On the Graph tab, click Add to New Dashboard.
In the Add to New Dashboard dialog box, configure the parameters based on your business requirements and click OK.
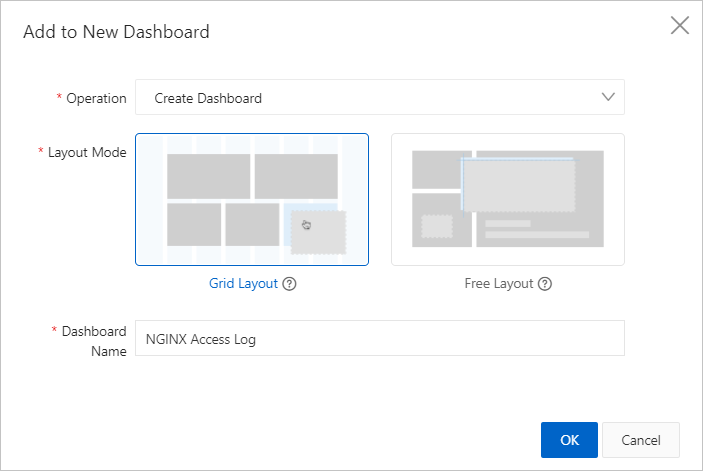
For more information about the dashboard parameters, see Add a chart to a dashboard.
Step 3: Configure a variable
To configure the query time range as a variable, perform the following operations:
In the left-side navigation pane, click the Dashboard icon and then click Dashboards.
In the Dashboard list, click NGINX Access Log.
In the upper-right corner of the NGINX Access Log page, click Edit. Find the chart for which you want to configure a variable and choose
 > Edit.
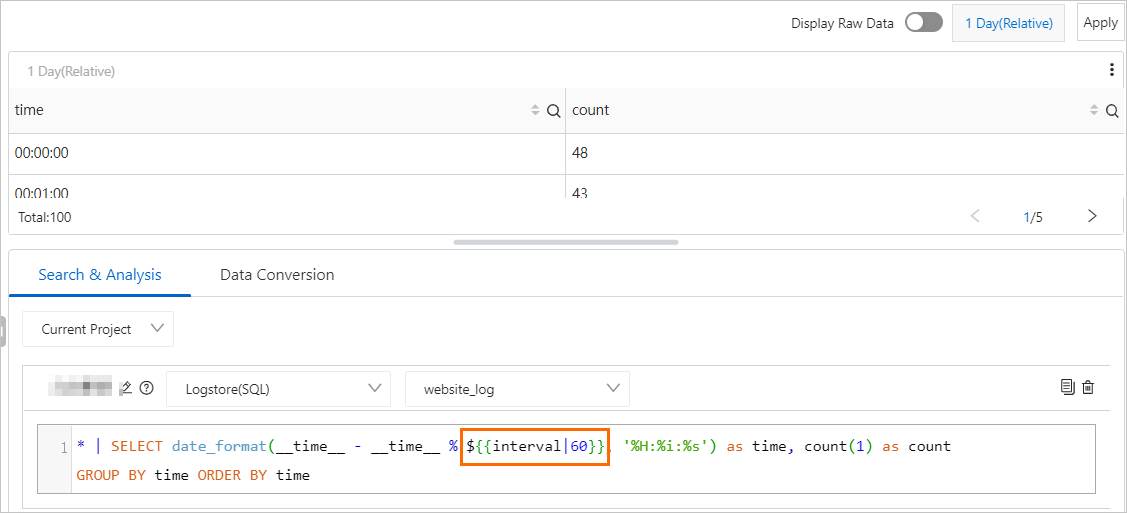
 Change 60 in the query statement to ${{interval|60}}, click Apply, and then click OK.
intervalis the name of the variable and 60 is the value of the variable. After the variable is configured, you can specify the value of the variable when you add a filter. If you use ${{interval}} to configure the variable, an error is reported when you query and analyze data.The following example shows the original query statement:
* | SELECT date_format(__time__ - __time__ % 60, '%H:%i:%s') as time, count(1) as count GROUP BY time ORDER BY timeThe following example shows the query statement after you configure the variable:
* | SELECT date_format(__time__ - __time__ % ${{interval|60}}, '%H:%i:%s') as time, count(1) as count GROUP BY time ORDER BY time
For more information about variables, see Use variables to dynamically modify the parameters of a query statement.
Step 4: Add a filter
To add a filter by using the variable that you configure, perform the following operations:
In the upper-right corner of the NGINX Access Log page, click the
 icon.
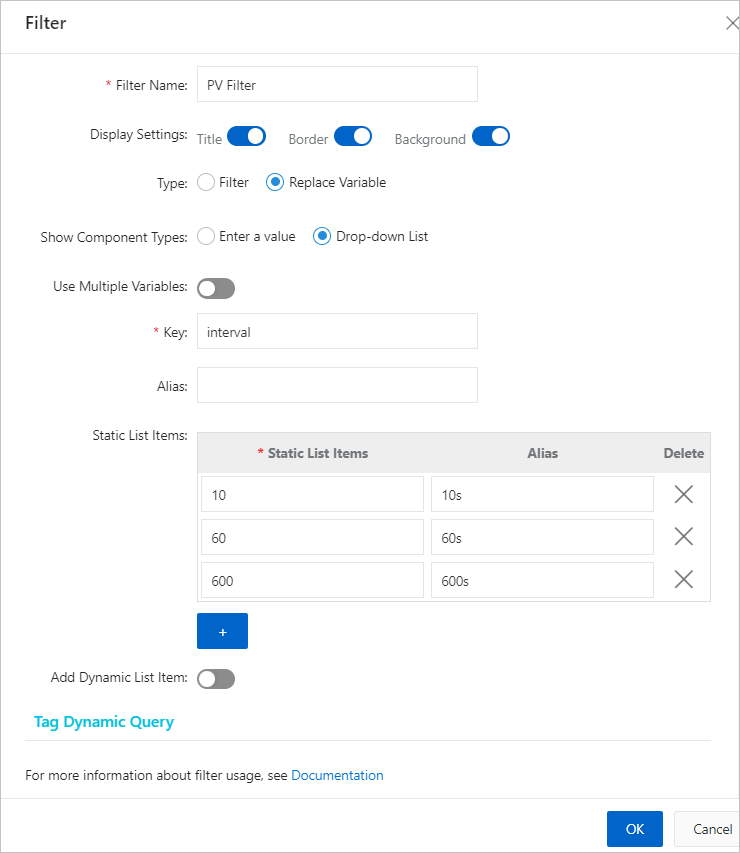
icon. In the Filter panel, configure the parameters and click OK.
NoteYou must set Type to Variable Replacement.
You must set Key Value to the variable that you configure in the "Step 3: Configure a variable" section. In this example, set Key Value to interval.
In the Static List Items section, you can specify different values for the interval variable.
 For more information about filter parameters, see Add a filter to filter data on a dashboard.
 Adjust the filter layout of the page and click Save.
In the Save Dashboard dialog box, click OK.
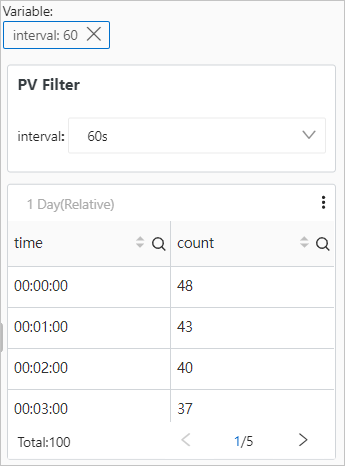
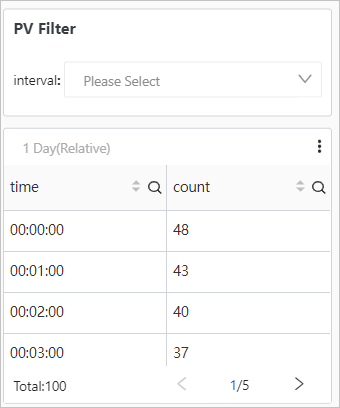
The NGINX Access Log dashboard displays the interval filter.
Step 5: Verify the results
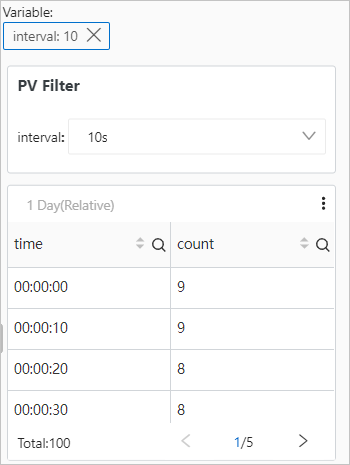
In the PV Filter section of the NGINX Access Log page, set interval to 10 to query the numbers of PVs per 10 seconds.
The following query statement is executed:
* | SELECT date_format(__time__ - __time__ % 10, '%H:%i:%s') as time, count(1) as count GROUP BY time ORDER BY timeThe NGINX Access Log dashboard displays the numbers of PVs per 10 seconds.
In the PV Filter section of the NGINX Access Log page, set interval to 60 to query the numbers of PVs per 60 seconds.
The following query statement is executed:
* | SELECT date_format(__time__ - __time__ % 60, '%H:%i:%s') as time, count(1) as count GROUP BY time ORDER BY timeThe NGINX Access Log dashboard displays the numbers of PVs per 60 seconds.