Create a scheduled SQL job to import data into a logstore or metricstore
Scheduled SQL jobs run queries at specified intervals after you perform custom analysis in a metricstore, enabling flexible and efficient time-series data analysis.
Prerequisites
Data is collected in a metricstore. For more information, see Metric data collection.
Create a scheduled SQL job in a metricstore
Log on to the Simple Log Service console. In the Projects section, click the project you want.

On the tab, click the metricstore you want.
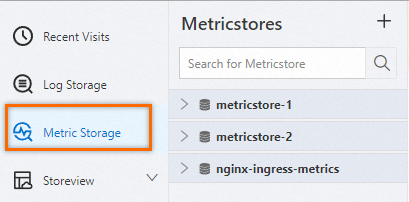
-
Choose . On the Custom Analysis page, enter an SQL query. For more information about the SQL syntax, see SQL syntax and SQL use cases.
For time-series data, the table name in the FROM clause of an SQL statement must be "{metrics_store_name}.prom".
{metrics_store_name}is the name of the source metricstore that contains the data. The table name must be enclosed in double quotation marks ("). For example,* | SELECT * FROM "my_metric_store.prom" WHERE __name__ != ''. The following table describes the fields in the query results.Field
Data type
Description
Example
__name__
varchar
The name of the metric.
nginx_ingress_controller_response_size
__labels__
map<varchar, varchar>
The label information. Format:
{key}#$#{value}|{key}#$#{value}|{key}#$#{value}.app#$#ingress-nginx|controller_class#$#nginx|controller_namespace#$#kube-system|controller_pod#$#nginx-ingress-controller-589877c6b7-hw9cj
__time_nano__
bigint
The timestamp in nanoseconds.
1585727297293000000
__value__
double
The value at a specific point in time.
36.0
-
On the Custom Analysis page, click Save as Scheduled SQL to save the query results as a scheduled SQL job.
When you run an SQL query on the Custom Analysis page, the time-series data is converted to log data. Use a scheduled SQL job to import the query results into a new logstore or metricstore.
In the Create Scheduled SQL panel, configure the job to import data into a logstore or a metricstore.
-
Import data to a logstore after data analytics in a metricstore
-
Import data to a metricstore after data analytics in a metricstore
Unlike importing data to a logstore, importing data to a metricstore has the following requirements for the data format and data types:
-
Metric fields: The log data must contain fields that can be converted to TSDB metrics, such as numeric fields for counts or averages. These fields are used to generate metric data in the TSDB.
-
Label fields (optional): Add label fields (Labels) to the log data for more granular categorization or query optimization of time-series data. You can also add static labels in the scheduled SQL job to enhance data locality.
-
Time field: The log data must include a timestamp field, such as __time__, that specifies the time of each log entry. If the __time__ field is not defined in the SQL code, the start time of the scheduling window is used as the timestamp by default.
-
Do not directly map __name__, __labels__, or __value__ to metric columns or labels.
-
-
Common SQL functions for data processing
element_at()
Use the element_at function to retrieve the value of a specific key from __labels__, for example, element_at(__labels__, 'key').
-
Example 1
Query and analyze all data.
*| SELECT * FROM "my_metric_store.prom" WHERE __name__ != '' -
Example 2
For the http_request_count metric, query data where the value of 'domain' in __labels__ is www.example.com, and calculate the sum of the __value__ field.
*| SELECT sum(__value__) FROM "my_metric_store.prom" WHERE __name__='http_request_count' and element_at(__labels__, 'domain')='www.example.com' -
Example 3
For the http_request_count metric, query data where the value of 'domain' in __labels__ is www.example.com, and calculate the sum of the __value__ field with an aggregation granularity of one hour.
*| SELECT sum(__value__),date_trunc('hour', __time_nano__/1000000) as t
FROM "my_metric_store.prom"
WHERE __name__='http_request_count' and element_at(__labels__, 'domain')='www.example.com'
GROUP BY t
ORDER BY t DESC
split_to_map()
__labels__ can be split into a map using the split_to_map function.
-
Example
* |
select
  split_to_map(__labels__, '|', '#$#') as labels,
  __name__ as metric,
  __value__ as value,
  __time_nano__ as time
FROM  "test-c.prom"
where
  __name__ != ''
References
Examples of using SQL to query a metricstore: