Data transformation jobs provide operational metrics, a built-in dashboard, and configurable monitoring alerts to help you track job health and performance.
Metric data
Running metrics for Data Transformation (New Version) jobs require SLS Job Operational Logs to be enabled. For more information, see Manage service logs.
Dashboard
Simple Log Service automatically creates a dashboard on each data transformation job's details page, displaying its operational metrics.
Procedure
Log on to the Simple Log Service console.
In the Projects section, click the one you want.

-
In the left-side navigation pane, choose .
-
Click the target data transformation job and view the dashboard in the Execution Status section.
Overall metrics
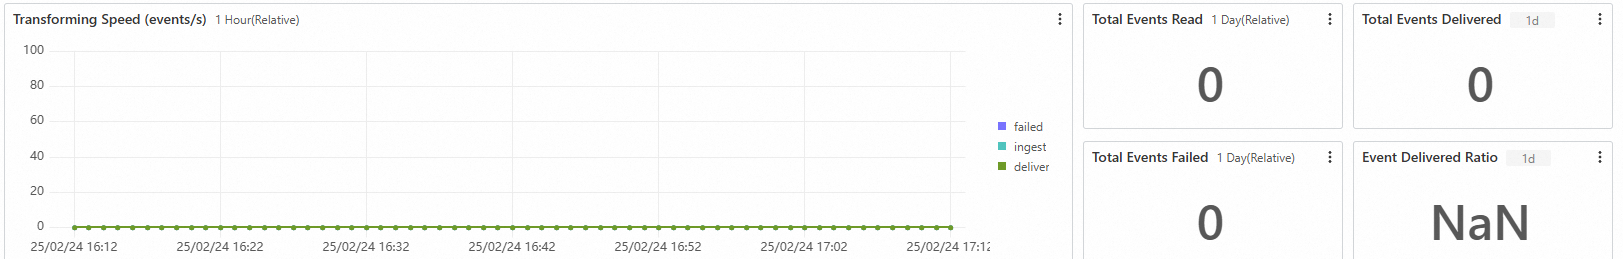
The dashboard includes the following key metrics:
-
Processing Rate: The data processing rate, measured in events per second. By default, this metric is calculated over a 1-minute window within a 1-hour period.
-
ingest: The number of events read from all shards in the source logstore.
-
deliver: The number of events successfully written to the destination logstore.
-
failed: The number of events that were read from the source logstore but failed during transformation.
-
-
Total Events Read: The total number of events read from all shards in the source logstore. The default statistical period is one day.
-
Total Events Delivered: The total number of events successfully written to all destination logstores. The default statistical period is one day.
-
Total Events Failed: The total number of events read from the source logstore that failed during transformation. The default statistical period is one day.
-
Event Delivery Ratio: The ratio of events successfully delivered to the destination logstore to the total events read from the source logstore. The default statistical period is one day.
Shard details
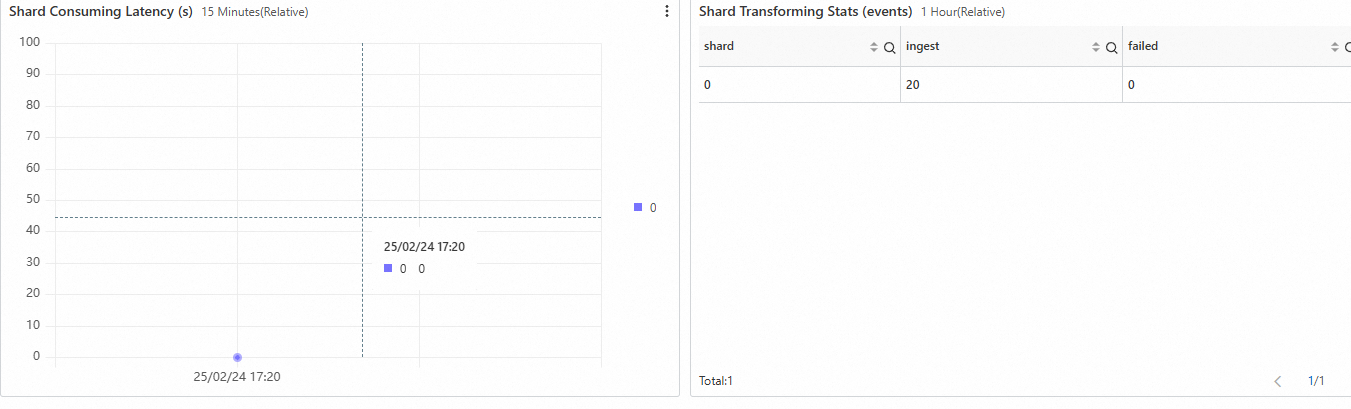
Shard-level metrics are collected at one-minute intervals as the job reads data from the source Logstore.
-
Shard Consumption Latency (s): For each shard, this is the time difference (in seconds) between the most recent event's ingestion time and the currently processed event's ingestion time. This indicates the processing delay.
-
Active Shard Statistics: The default statistical period is one hour.
-
shard: The ID of the shard.
-
ingest: The number of raw events read from the shard.
-
failed: The number of raw events read from the shard that failed during transformation.
-
Runtime exceptions
Error details are available in the message field.
For example, the log table on the error details page contains four columns: time, level, action, and message. When the level is ERROR and the action is deliver, the message field might display an error like {"Code":"InvalidArgs","Message":"failed to get sts token: ...The role not exists: acs:ram::*:role/test-role."}. This message indicates that the system failed to obtain an STS token because the specified RAM role does not exist.
Alert rules
You can create alert rules based on the operational metrics in Metric data to monitor processing latency, exceptions, and traffic changes. For more information about alerting, see Alerts. To create an alert rule, see Create a log-based alert rule.
When creating an alert rule for a data transformation job, ensure the query targets the same project and logstore where the job's operational logs are stored. For more information, see Manage service logs.
In the Query and Analyze dialog box, click the Advanced Settings tab. Set Type to Logstore and Authorization Method to Default. Select the target Region, and enter the names for the project and logstore. As needed, configure dedicated SQL (you can select Auto, Enable, or Disable) and the time range. Then, click Confirm.
Monitoring processing latency
|
Item |
Description |
|
Purpose |
Monitors the shard consumption latency in a data transformation job. An alert is triggered if the processing latency exceeds the specified threshold. |
|
Associated dashboard metric |
|
|
Sample analysis query |
Replace |
|
Alert rule settings |
Note
To avoid false alarms caused by periodic metric updates (every 1 minute) or latency caused by sudden data spikes, we recommend using these settings. |
|
How to resolve alerts |
To resolve these alerts:
|
Monitoring processing exceptions
|
Item |
Description |
|
Purpose |
Triggers an alert when an exception occurs during a data transformation job. |
|
Associated dashboard metric |
See Runtime exceptions. |
|
Sample analysis query |
Replace |
|
Alert rule settings |
|
|
How to resolve alerts |
Troubleshoot based on the error message:
|
Monitoring written data volume ratio (period-over-period)
|
Item |
Description |
|
Purpose |
Triggers an alert based on period-over-period changes in the data delivery ratio (written volume vs. read volume). The rule compares the current ratio to the same period from the previous day and week, triggering an alert if the change exceeds your configured growth or decline thresholds. |
|
Associated dashboard metric |
Event Delivery Ratio: The ratio of events successfully delivered to the destination logstore to the total events read from the source logstore. The default statistical period is one day. |
|
Sample analysis query |
Enter the following query in the Query and Analyze dialog box when you create the alert rule. Replace |
|
Alert rule settings |
Note
To avoid false alarms from periodic fluctuations in raw data traffic, we recommend setting the daily/weekly growth and decline thresholds to at least 20%, or adjusting the comparison period to match the cycle of your raw data traffic. |
|
How to resolve alerts |
To resolve these alerts:
|
Monitoring source event count (period-over-period)
|
Item |
Description |
|
Purpose |
Triggers an alert if the number of events read by the data transformation job changes significantly compared to the previous day and week. The rule fires if the event count exceeds a growth threshold or falls below a decline threshold. |
|
Associated dashboard metric |
Total Events Read: The total number of events read from all shards in the source logstore. The default statistical period is one day. |
|
Sample analysis query |
Enter the following query in the Query and Analyze dialog box when you create the alert rule. Replace |
|
Alert rule settings |
Note
To avoid false alarms from periodic fluctuations in raw data traffic, we recommend setting the daily/weekly growth and decline thresholds to at least 20%, or adjusting the comparison period to match the cycle of your raw data traffic. |
|
How to resolve alerts |
To resolve these alerts:
|
Monitoring delivered event count (period-over-period)
|
Item |
Description |
|
Purpose |
Triggers an alert if the number of events written by the data transformation job changes significantly compared to the previous day and week. The rule fires if the event count exceeds a growth threshold or falls below a decline threshold. |
|
Associated dashboard metric |
Total Events Delivered |
|
Sample analysis query |
Enter the following query in the Query and Analyze dialog box when you create the alert rule. Replace |
|
Alert rule settings |
Note
To avoid false alarms from periodic fluctuations in raw data traffic, we recommend setting the daily/weekly growth and decline thresholds to at least 20%, or adjusting the comparison period to match the cycle of your raw data traffic. |
|
How to resolve alerts |
To resolve these alerts:
|