Learn how to train an anomaly detection model by aggregating metric data with SQL in Intelligent Inspection.
Prerequisites
-
Logs collected in the source Logstore. Data collection overview.
-
Index configured for the source Logstore. Create an index.
-
Intelligent Anomaly Analysis instance created. Create an instance.
Create an Intelligent Inspection job
Navigate to the creation page
Log on to the Simple Log Service console.
-
-
In the Log Application section, click Intelligent Anomaly Analysis.
-
In the instance list, click the target instance.
-
In the left-side navigation pane, click Intelligent Inspection.
-
Click Real-time Inspection.
-
In the Inspection Job section, click Create Now.
-
Basic information
In the Basic Information step of the Create Intelligent Inspection Job wizard, configure the following parameters and click Next.
|
Parameter |
Description |
|
Task Name |
Custom name for the inspection job. |
|
Project |
Project that contains the source Logstore or Metricstore. |
|
Region |
Region of the selected Project. |
|
Logstore Type |
The type of store that contains your data.
|
|
Source Logstore |
When Logstore Type is set to Logstores, specify the Source Logstore, the Logstore that contains your source data. |
|
Metricstores |
When Logstore Type is set to Metricstores, set Metricstores to the Metricstore that contains your source data. |
|
Role |
Automatically populated with the |
|
Target Store |
Destination Logstore. Fixed to |
Data feature configuration
If your time-series data contains anomaly labels, select the Data Feature Settings tab. Otherwise, select the Anomaly Injection tab.
-
Query and analysis syntax is covered in Query overview and Overview of query and analysis.
Data features
-
Query Statement
* | select (__time__ - __time__%60) as time, entity, count(*) as metric, if(count(*) > 1000, 1, 0) as label from log group by time, entity limit 1000000 -
Label Name:
label -
Entity:
entity -
Feature:
metricParameter
Description
Time
Time column in the source data.
Granularity
Observation interval in seconds. Valid values: 5 to 3600. Recommended: 60 or greater.
Entity
Entity identifier in the source data. Used to aggregate data and generate time series.
Feature
Feature identifier in the source data.
Label name
Anomaly label in the source data.
-
1 indicates that the data point is anomalous.
-
0 indicates that the data point is normal.
-
Anomaly injection
-
Query Statement
* | select (__time__ - __time__%60) as time, entity, count(*) as metric from log group by time, entity limit 1000000 -
Entity:
entity -
Feature:
metric -
Anomaly rate:
0.001
Parameter
Description
Time
Time column in the source data.
Granularity
Observation interval in seconds. Valid values: 5 to 3600. Recommended: 60 or greater.
Entity
Entity identifier in the source data. Used to aggregate data and generate time series.
Feature
Feature identifier in the source data.
Anomaly Injection
Whether to save data after anomaly injection.
Anomaly rate
Ratio of injected anomalous data to total time-series data. For example, 0.001 means 0.1% of data points are anomalous after injection.
Anomaly type
Anomaly types to inject into the feature sequence.
-
Algorithm configuration
-
In the Algorithm configuration section, select an Algorithm. Only supervised anomaly detection algorithms are supported.
-
In the Scheduling Settings section, configure the following parameters.
Parameter
Description
Start at
Start time of the time series for training.
End time
End time of the time series for training.
End time of model learning
End of the training period. Must be between Start at and End time. Data before this point trains the model; data after validates it.
Manage an Intelligent Inspection job
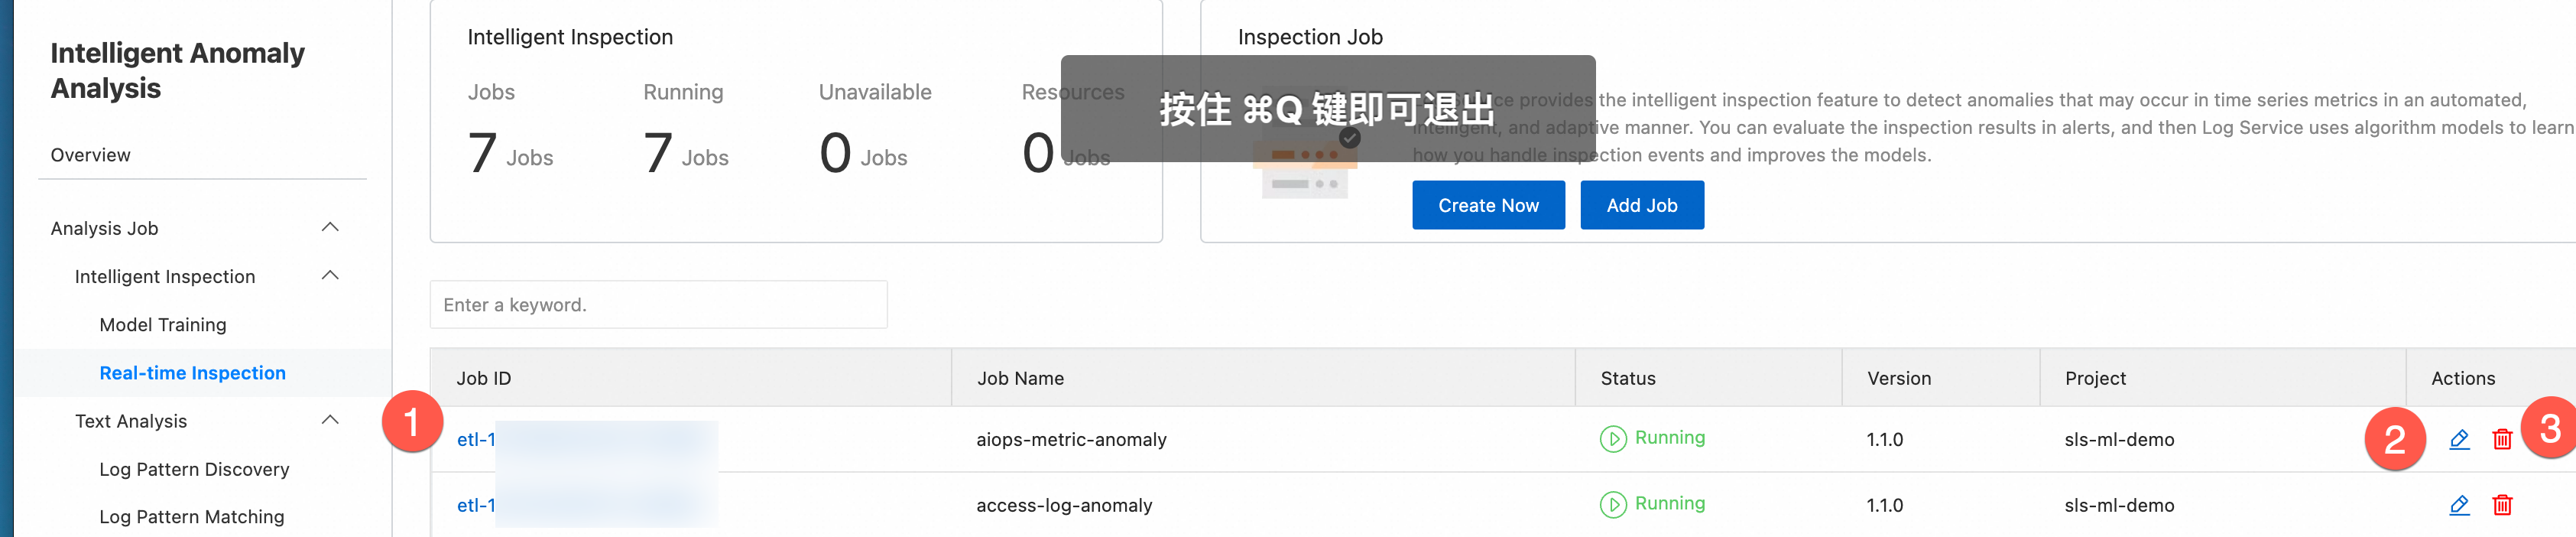
-
View a job: Click a job ID in the job list to view it.
-
In the Entity Information list, click an entity ID.
-
In the panel that appears, create a prediction job.
Parameter
Description
Task name
Name of the prediction job.
Entity ID
Entity ID sequences to inspect.
Anomaly type to follow
The anomaly types to monitor.
Start at
Time from which the job starts reading and inspecting data.
Data latency
Maximum expected delay (seconds) for data to arrive in SLS. The job waits this duration to ensure data completeness.
Send alert
Whether to send alerts for detected anomalies.
Alert Policy
Merges, silences, and suppresses triggered alerts.
-
If you select Simple Mode or Standard Mode, you do not need to configure an Alert Policy. Simple Log Service uses the built-in dynamic alert policy (
sls.builtin.dynamic) by default. -
If you select Advanced Mode, you can select a built-in or custom Alert Policy. To create an Alert Policy, see Create an Alert Policy.
Action Policy
Controls notification channels and frequency.
-
If you select Simple Mode for the Alert Policy, you only need to configure an action group. SLS automatically creates an Action Policy named
<Rule Name>-Action Policyto send all alerts triggered by this rule. For notification channel configuration, see Notification methods. -
If you select Standard Mode or Advanced Mode for Alert Policy, you can select a built-in or custom Action Policy to manage alert notifications. To create an Action Policy, see Action Policy. If you select Advanced Mode for Alert Policy, you can also enable or disable Custom Action Policy. Dynamic action policy mechanism.
-
-
-
Edit a job:
-
Delete a job:
ImportantDeleted inspection jobs cannot be restored.