To view tables from different query results in a dashboard, use the Connect data conversion to join them.
Prerequisites
-
You have collected log data. For more information, see Collect text logs from a host.
-
You have created indexes. For more information, see Create an index.
Overview
For example, on the Create Chart page, select the Data Conversion tab, set the join type to Left Join and the join field to __time__, and then click Apply to join tables.
-
Query and analysis: You can query and analyze logs in the console, such as log search, log aggregation, and log statistics.
-
Add a chart: Each dashboard consists of multiple charts. Each chart represents the results of one or more query statements.
-
Join tables: Combine results from different queries based on a common field.
Step 1: Query and analysis
Log on to the Simple Log Service console. In the Projects section, click the project you want.

On the tab, click the logstore you want.
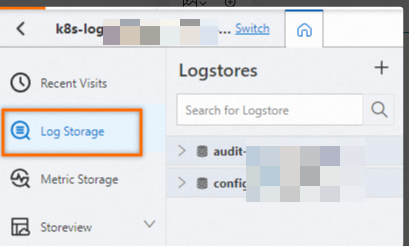
-
Enter a query statement, and then click Last 15 Minutes to set the time range.
Example:
-
The query statement for Query A is as follows:
* | select __time__,request_method,status limit 10000 -
The query statement for Query B is as follows:
* | select __time__,request_url
-
Step 2: Add a chart
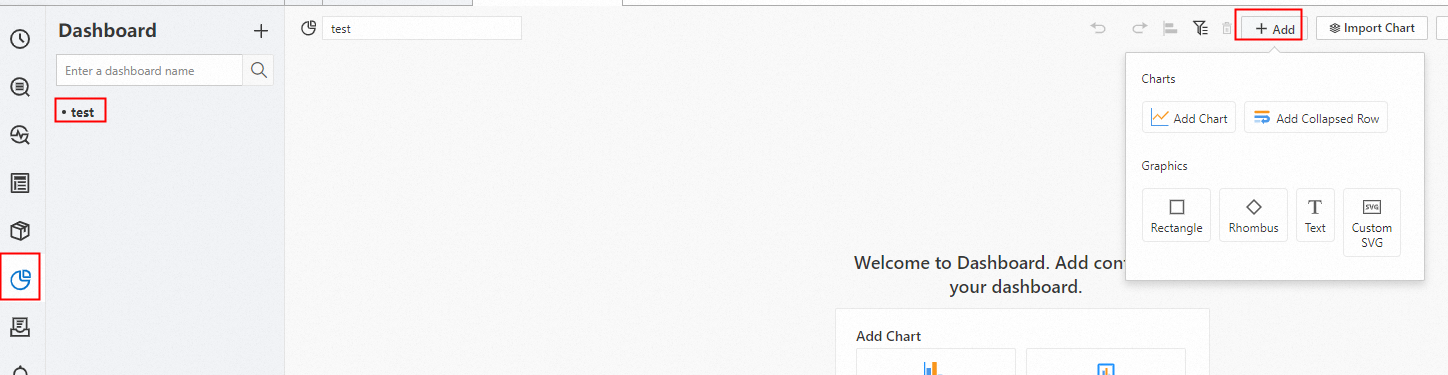
In the left-side navigation pane, choose . In the Dashboard list, click the dashboard you want. In the upper-right corner of the dashboard page, click Edit. In edit mode, choose .
-
In the section, select the
 icon for Chart Type. On the Query and Analysis tab, select your data source (in this case, LogStore (SQL)), select the target Logstore, and enter a query statement.
In the upper-right corner, select a time range such as Last 15 Minutes and click Apply.
Set Chart Type to Table. An example query:
* | select *.
Step 3: Join tables
Choose . Set the join field to __time__ and the join type to Left Join to combine the results from Query A and Query B. Click Apply to view the joined results.