Tables let you merge results from multiple queries into a single view and customize field-level display settings.
Introduction
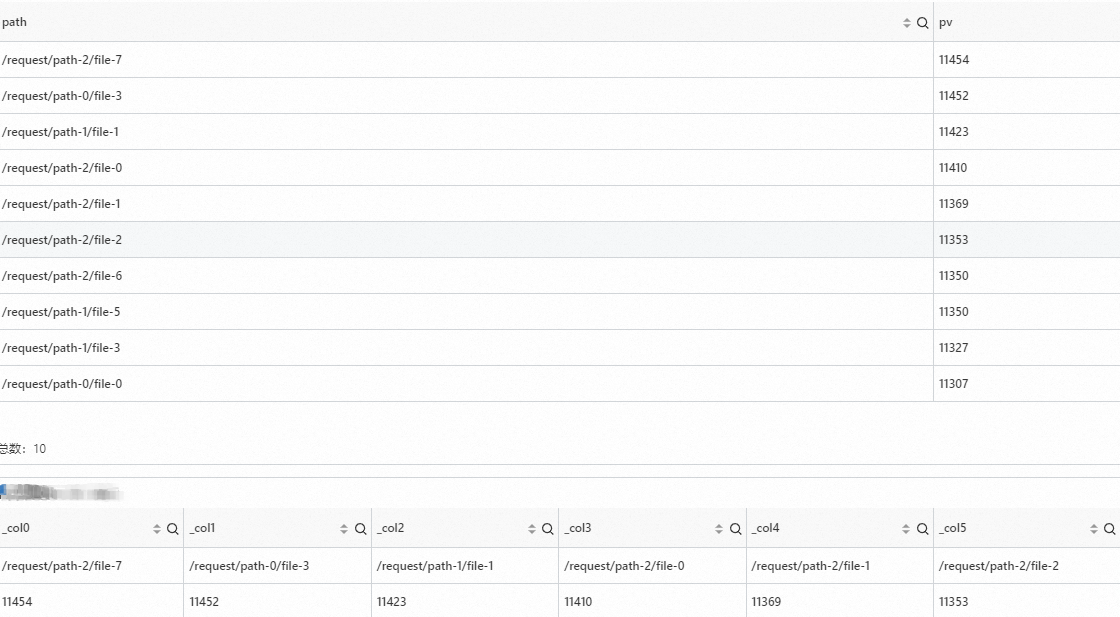
Query and analysis results are displayed in a table by default.
To add a table, see Add a chart to a dashboard.
Table types
|
Table type |
Sample |
Related Links |
|
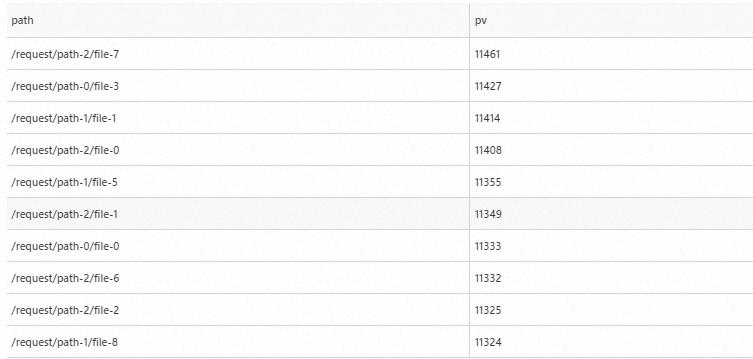
Basic table |
|
|
|
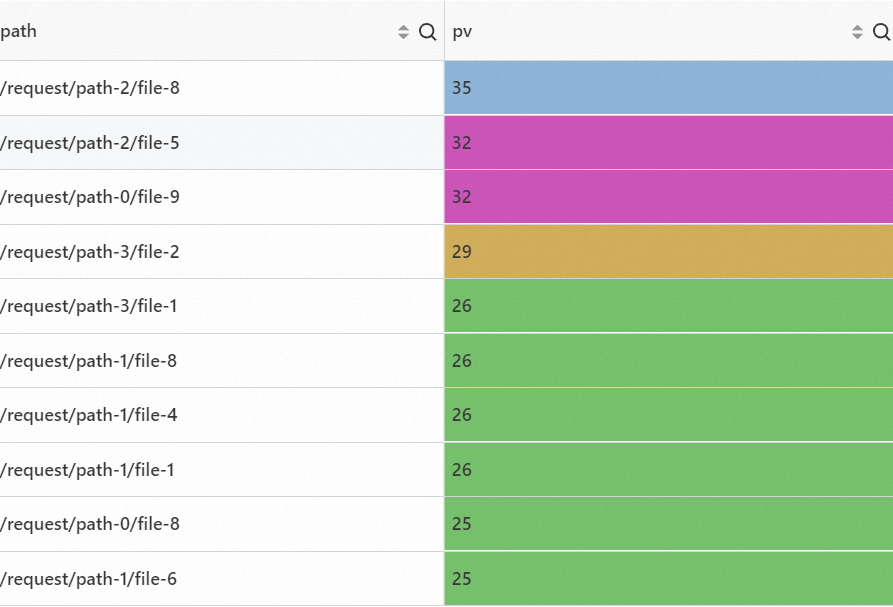
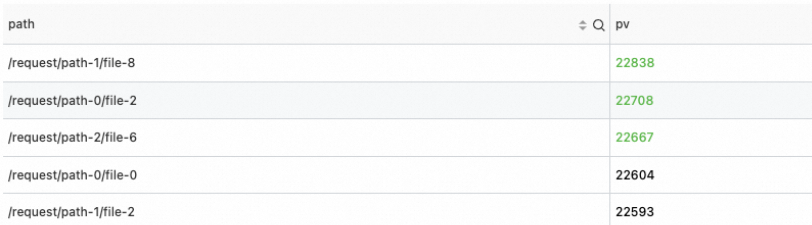
Highlight |
|
|
|
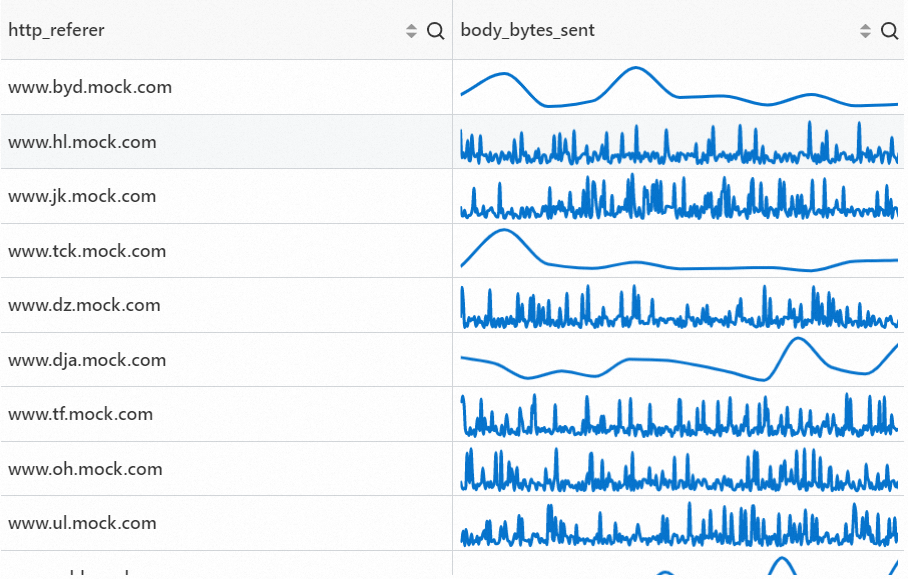
Sparkline |
|
|
|
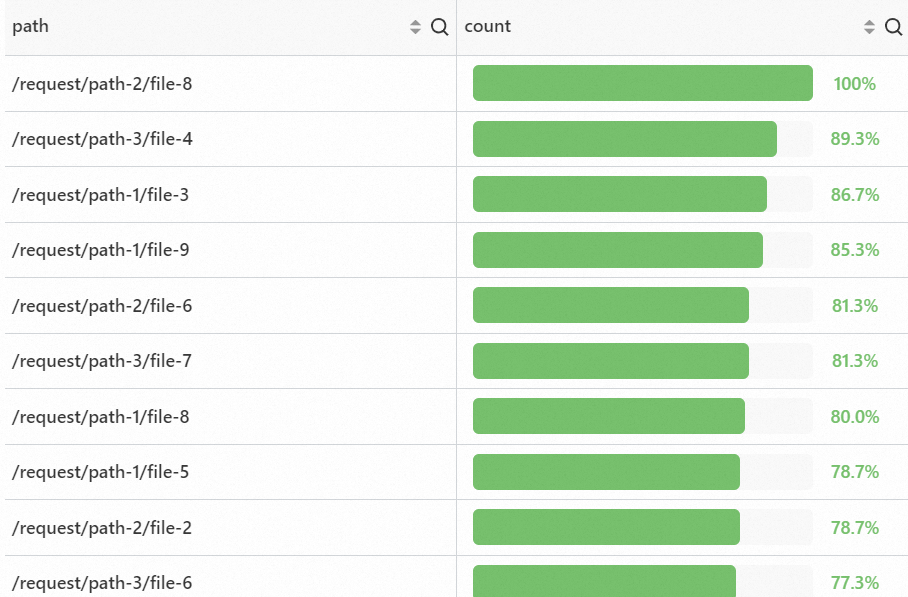
Progress bar |
|
Configuration example
Basic table
Log on to the Simple Log Service console. In the Projects section, click the project you want.

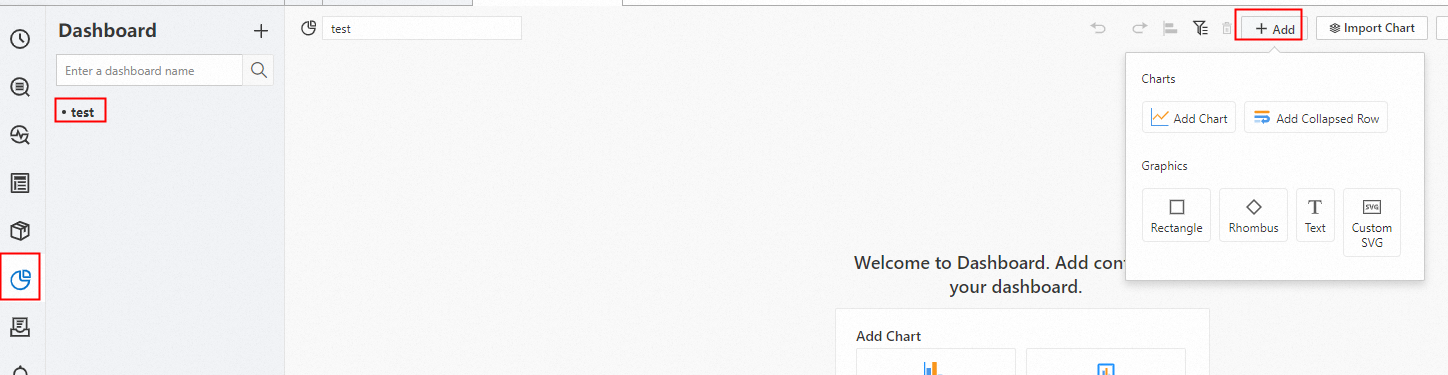
In the left-side navigation pane, choose . In the Dashboard list, click the dashboard you want. In the upper-right corner of the dashboard page, click Edit. In edit mode, choose .
-
In the section, click
 . Enter a query and analysis statement, and then click Last 15 Minutes to set the time range for the query and analysis.
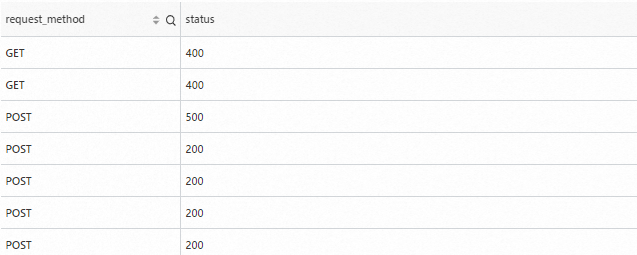
For example, to view request methods and status for all requests:
* | SELECT request_method,status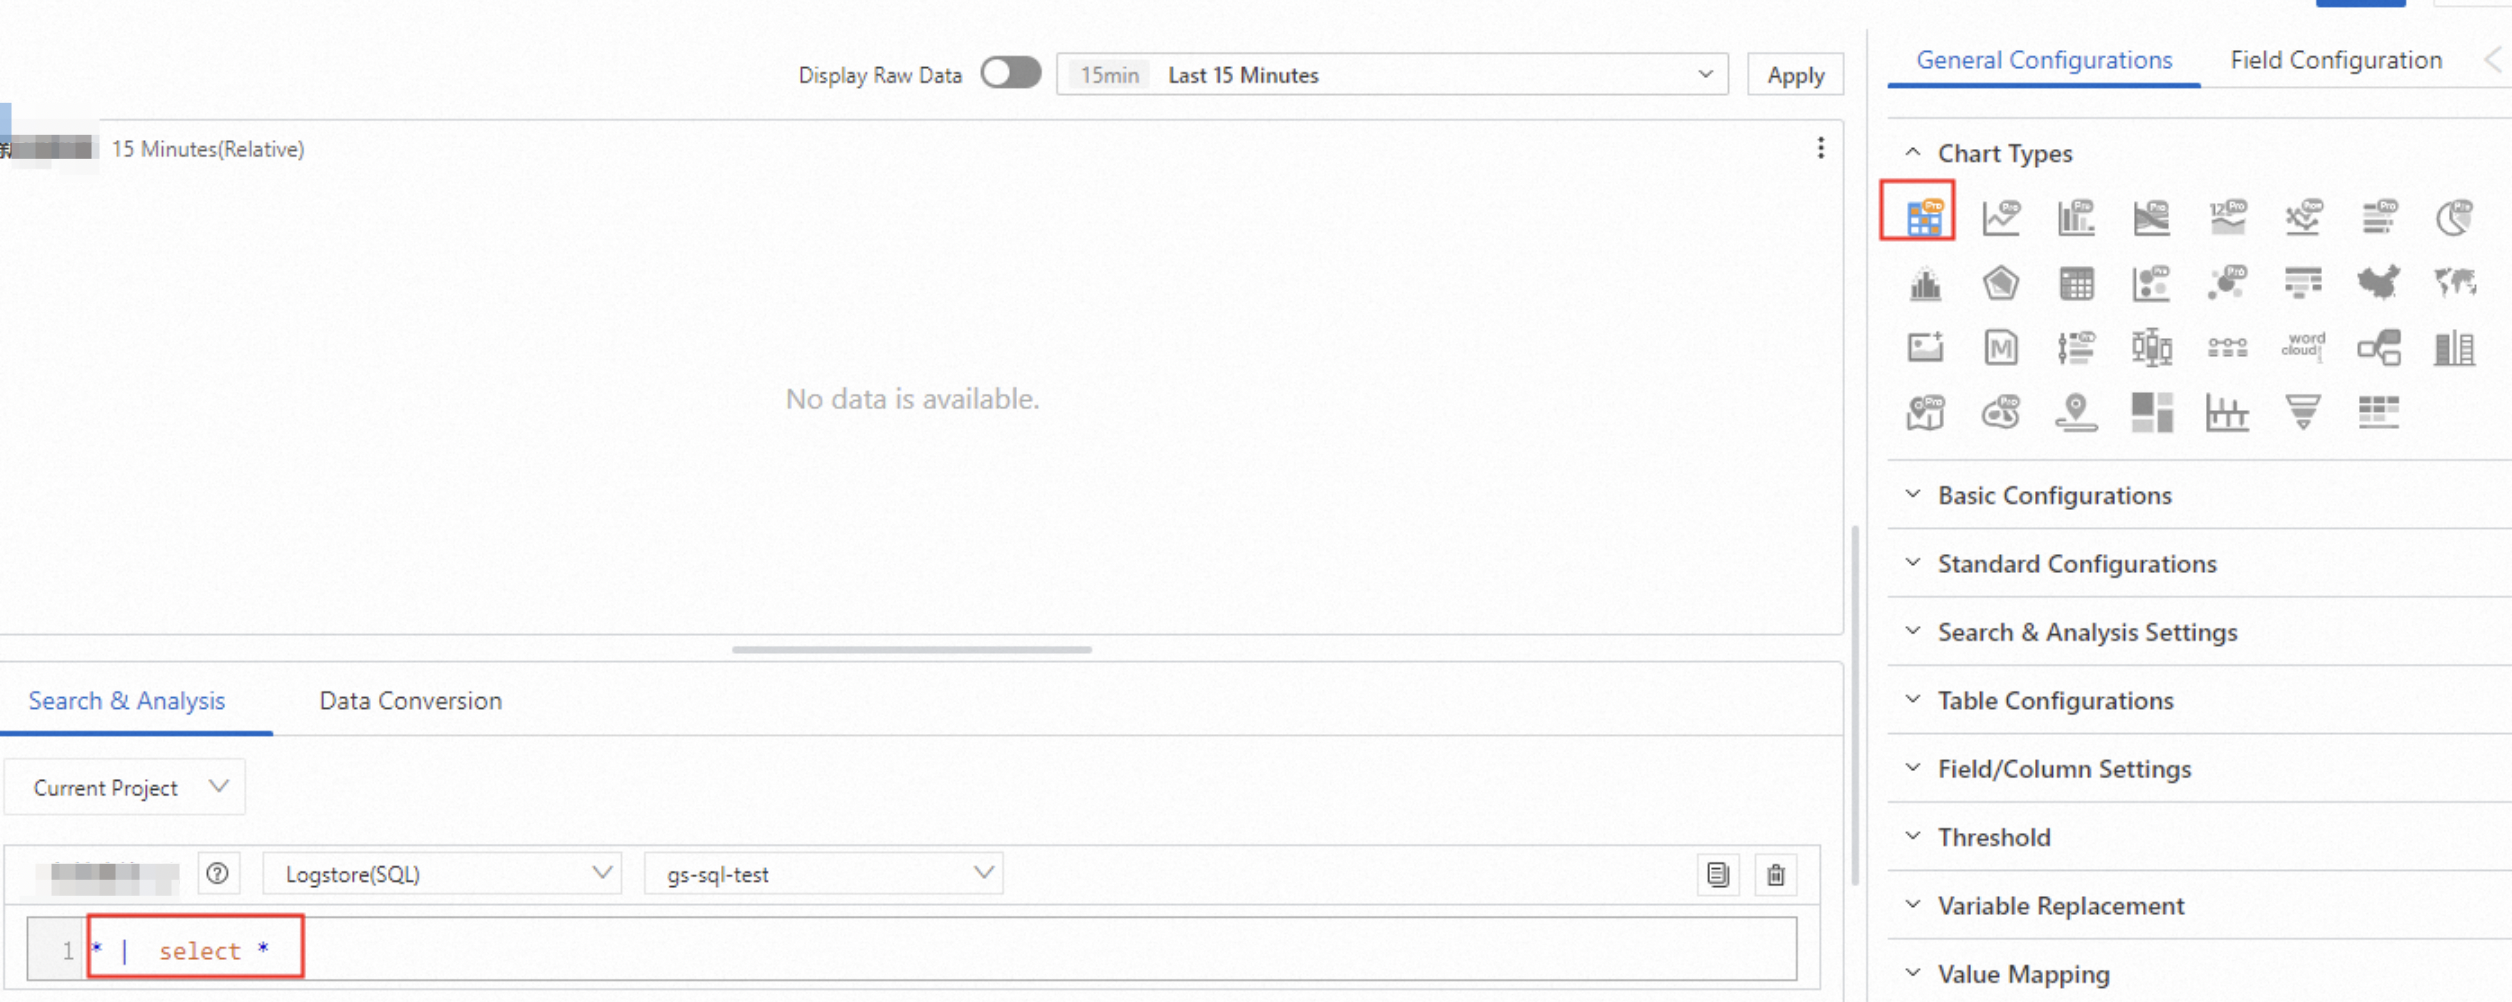
Other configurations
|
Table configuration |
Description |
Preview |
|
Value mapping |
Value mapping converts raw log data based on custom rules for clearer dashboard display. Add value mapping to a table. |
|
|
Set row and column transformation |
Row and column transformation presents data from different perspectives to reveal correlations and trends. Add row and column transformation to a table. |
|
|
Set row height and column width |
Adjust row height and column width for better readability. Set the row height and column width of a table. |
|
|
Merge tables |
Merge tables to display multiple data items in a compact view and highlight key metrics. Merge tables. |
|
|
Set thresholds |
Set thresholds to detect when data exceeds preset ranges for metrics such as response time and throughput. Set table thresholds. |
|
|
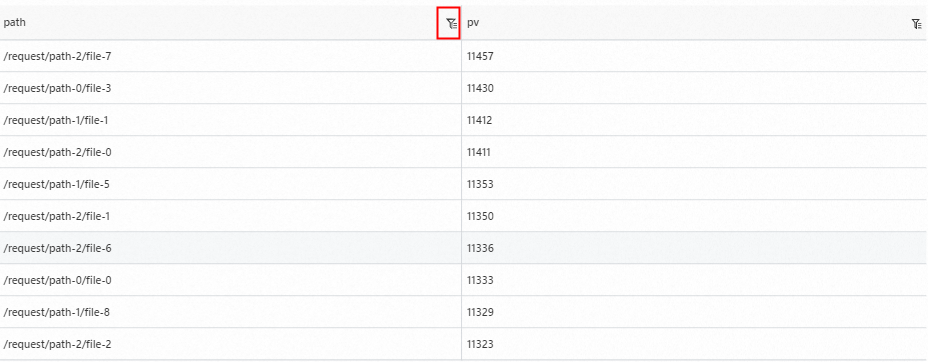
Configure search, filtering, variable substitution, and multiple query statements |
Search and filter large datasets, use variable substitution to dynamically change displayed content, and run multiple query statements for multi-dimensional reports across time, type, and user dimensions. Configure search, filtering, variable substitution, and multiple query statements. |
|
General configurations
Configure global settings for the table.
-
Basic configurations
Parameter
Description
Title
Set the title of the chart.
Display Title
When you turn on the Display Title switch, the title is displayed in the chart.
Display Border
When you turn on Display Border, a border is displayed in the chart.
Display Background
After you turn on the Display Background switch, a background color is displayed in the chart.
Display Time
After you turn on the Display Time switch, the query time is displayed in the chart.
Fixed Time
After you turn on the Fixed Time switch, the time range for the query and analysis is fixed and is not affected by the global time of the dashboard.
-
Standard configurations
Parameter
Description
Format
Set the display format for numbers.
Unit
Set the unit for numbers.
Number of Digits after Decimal Point
Set the number of decimal places for numbers.
Display Name
Set the display name for the field.
This name overrides all other field names in the chart. To rename a specific field, use a field configuration.
Color Scheme
Select the color scheme for the chart.
-
Built-in: Use the built-in colors.
-
Solid: Select a single color.
-
Threshold: Colors the chart based on configured thresholds.
-
-
Query and analysis settings
Parameter
Description
Hide Field
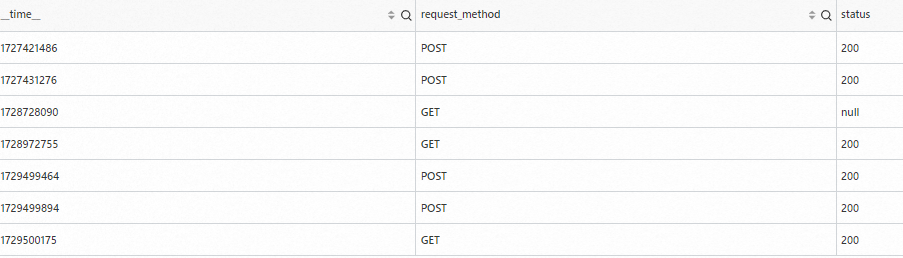
Hides a column from the results. For example, selecting __time__ hides the __time__ column.
-
Table configurations
Parameter
Description
Display mode
The display mode of the table.
-
Paging: Displays data by page. Set Items per page to control rows per page.
-
Fixed height: Displays all data on a single page. Set Row height to control row height.
Items per page
Number of rows per page.
Sort by
Sorts the table by the selected field.
Sorting method
The sorting order for the selected field.
-
Default.
-
Ascending
-
Descending
Display header
Display header: shows the table header row.
Display total
Display total: shows the total row count.
Transparent background
Transparent background: uses a transparent background for the table.
-
-
Field and column settings
Parameter
Description
Minimum column width
Minimum column width in pixels.
Auto-scaled columns do not shrink below this value.
Column width
Column width in pixels.
By default, column width is calculated from the table size and minimum column width. If set, this value overrides the calculated width.
Maximum
Maximum value of the progress bar. Defaults to the column maximum if not set.
The Maximum parameter takes effect only when Cell display mode is set to Progress bar, LCD progress bar, or Gradient progress bar.
Cell display mode
The display mode of the cell.
Alignment
The alignment of the content in the cell.
Disable sorting
Disable sorting: disables column sorting.
Disable search
Disable search: disables column search.
Search mode
The search mode for data in the table.
-
Search: Enter a value to search.
-
Filter: Filter data on the page.
Enable multiple selections
Allows selecting multiple values when searching data.
-
Multiple selections.
-
Single selection.
Exact search
Exact search: restricts search to exact matches only.
Font size
The font size of the content in the cell.
Show all
Show all: displays full field values without truncation.
-
-
Thresholds
Parameter
Description
Threshold
The threshold for the data.
If you set Color scheme to Threshold and set thresholds here, the text in the table is displayed in the corresponding threshold colors.
-
Variable substitution
Parameter
Description
Variable substitution
Variable substitution adds a variable-type filter to the chart. After configuration in General configurations, a filter appears in the upper-left corner of the chart. When you select a value, Simple Log Service replaces the variable in the query statement and reruns the analysis. Example 2: Set variable substitution.
-
Value mapping
Parameter
Description
Value mapping
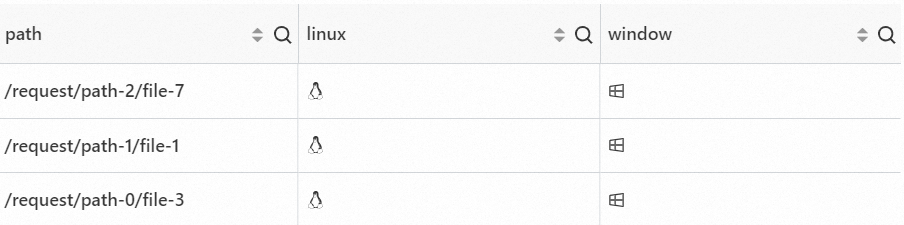
You can replace values in the table with words or icons.
For example, set Value to 200, Mapping type to Text, and Mapping value to Success. Then, 200 in the table is replaced with Success.
-
Documentation link
Parameter
Description
Add documentation link
Adds a custom link or description to the upper-right corner of the table.
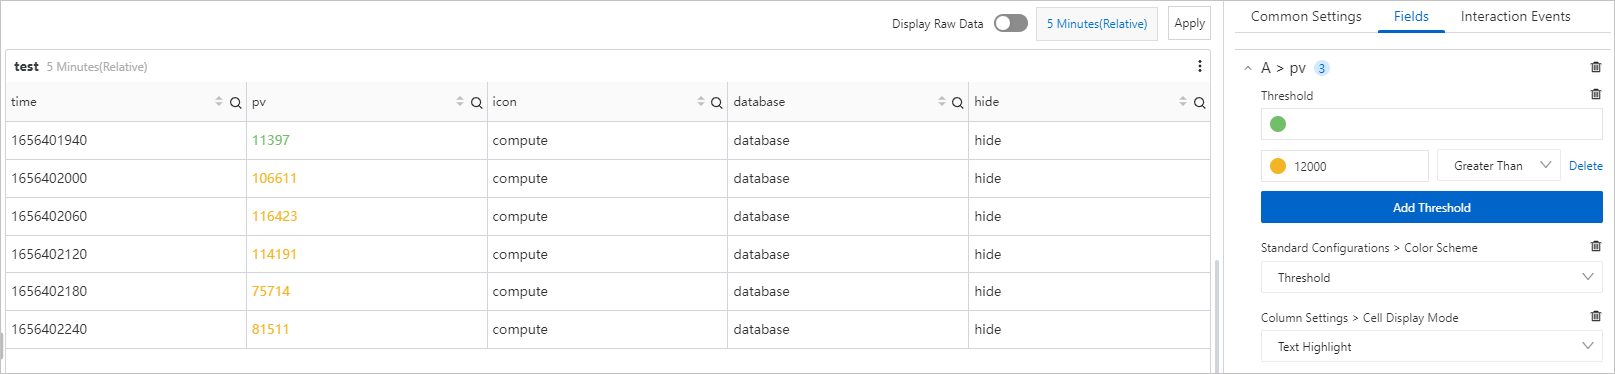
Field configuration
Customize visualization settings for individual query results or data columns. The available items match those in General configurations.
For example, A > pv configures the pv field in Query A results, highlighting pv values in threshold-based colors.
Interaction events
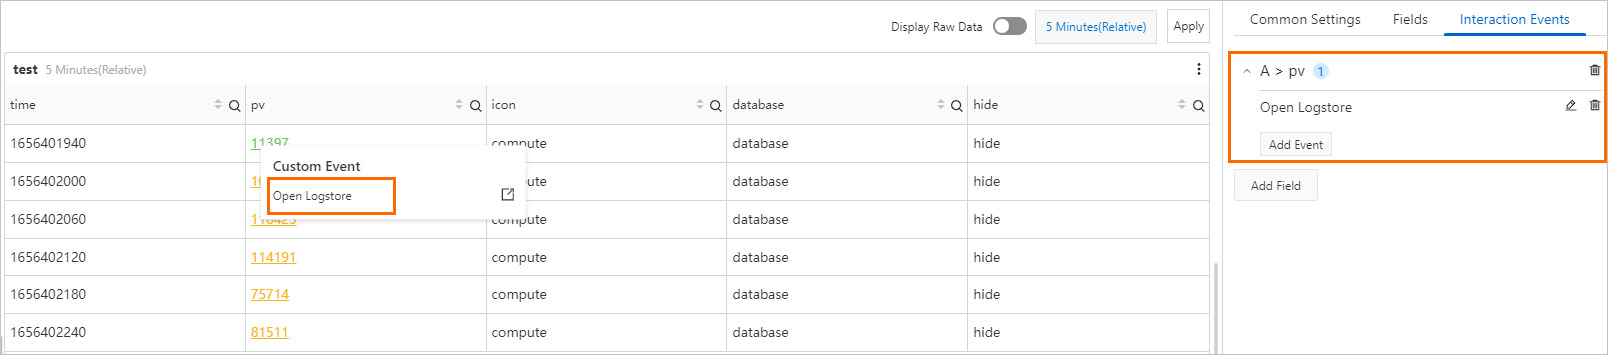
Interaction events add drill-down capabilities to query results or data columns. Supported events: Open Logstore, Open Saved Search, Open Dashboard, Open Trace Analysis, Open Trace Details, and Custom HTTP Link. Add drill-down analysis events to a dashboard.
For example, A > pv sets an event for the pv field in Query A. Setting the pv event to Open Logstore lets you click a pv value and then click Open Logstore to navigate to the specified Logstore.