Telegraf is an open-source data collector from InfluxData that supports input and output plugins for sources such as MySQL, Redis, and Elasticsearch. This topic describes how Telegraf integrates with Simple Log Service, how to install it, and which collection mode fits your setup.
How it works
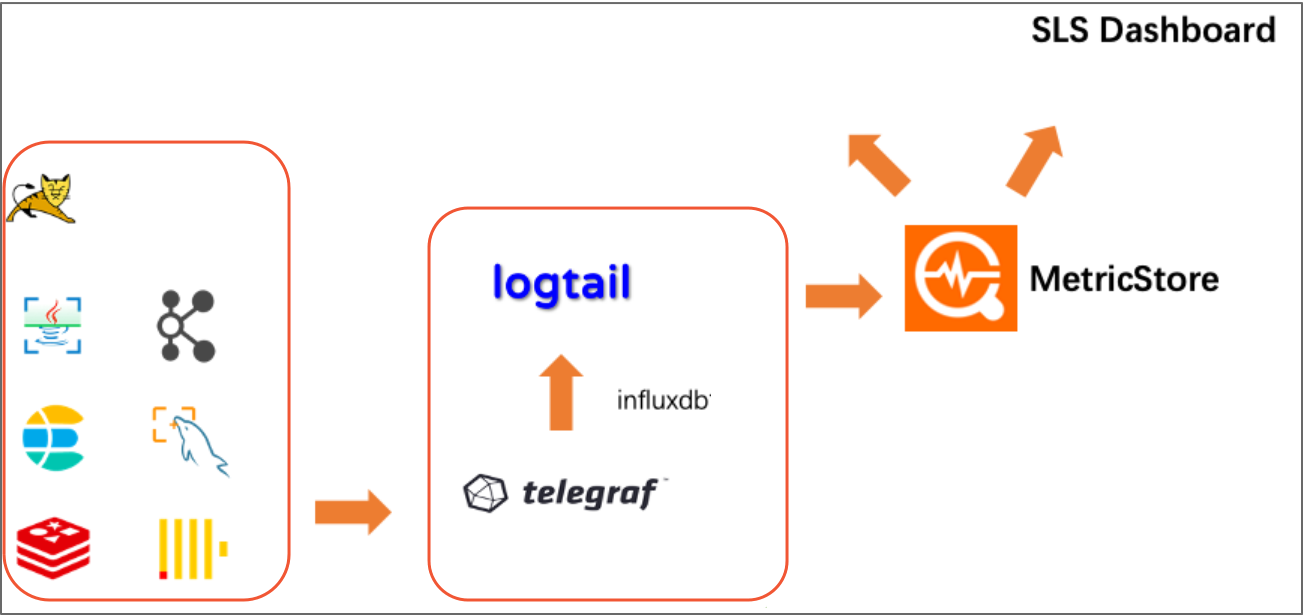
Simple Log Service provides monitoring templates that use Telegraf to collect metrics. Telegraf sends monitoring data from sources such as MySQL, Redis, and Elasticsearch to Logtail over the InfluxDB protocol. Logtail then uploads the data to a MetricStore in Simple Log Service. For common plugins, Simple Log Service provides a configuration interface and automatically creates dashboards.
Install Telegraf
Prerequisites
Before you install Telegraf, check your Logtail version:
Logtail 0.16.50 or later: No manual steps needed. Telegraf installs automatically the first time the server detects a Telegraf configuration.
Logtail 0.16.48 to 0.16.49: Update Logtail to the latest version. If you cannot update, follow the manual installation steps below.
Manual installation
If you are on Logtail 0.16.48 or 0.16.49 and cannot update, install Telegraf manually:
Confirm the region of the server where you want to install Telegraf and select a network type. For more information, see Logtail network types, startup parameters, and configuration files.
-
Download the logtail.sh installation script. For more information, see Install Logtail on a Linux server.
After downloading the script, do not run it. If you are unsure of your network environment, download the script from the public network.
wget http://logtail-release-cn-hangzhou.oss-cn-hangzhou.aliyuncs.com/linux64/logtail.sh -O logtail.sh; chmod 755 logtail.sh -
Install Telegraf.
sudo ./logtail.sh install-agent ${region} telegrafReplace ${region} with the region where the server is located, for example, sudo ./logtail.sh install-agent cn-hangzhou telegraf.
-
Verify the installation.
Run the following command to list the telegraf directory. A successful installation includes files such as telegraf and telegrafd.
ls /etc/ilogtail/telegraf
Collection modes
Telegraf supports two collection modes:
-
Local collection
Telegraf collects metrics from the server it runs on. The servers in your machine group are the target servers. On the configuration page, set the server address to 127.0.0.1. This mode suits most use cases.
-
Remote collection
Install Telegraf on a dedicated server to remotely collect metrics from other servers. Set the server address on the configuration page to the IP address or domain name of the target server.
WarningWhen using remote collection, the machine group must contain exactly one server. If the machine group contains multiple servers, duplicate data is generated.
This mode is suitable for the following scenarios:
The target is a cloud service where you cannot deploy Logtail or Telegraf.
You need non-intrusive monitoring and prefer not to deploy an additional data collector on a server that is already running other services.