This topic describes how to configure a trend chart to analyze log data trends.
Prerequisites
Data has been collected. For more information, see Collect text logs from servers.
Indexes have been created. For more information, see Create indexes.
A dashboard has been created. For more information, see Create a dashboard.
Overview

Query and analyze data: Count the page views (PVs) of a webpage in the console to ensure the completeness and accuracy of your log data.
Configure a trend chart: Add a trend chart named
statistical-chart, configure a comparison value for it, and then add the chart to the target dashboard.
Step 1: Query and analyze data
Log on to the Simple Log Service console. In the Projects section, click the project you want.

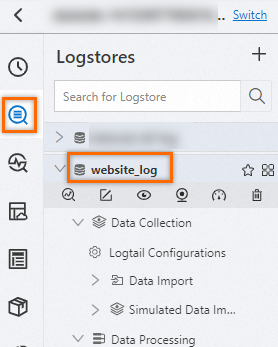
In the navigation pane on the left, click Log Storage. In the Logstores list, click the target Logstore.
Enter the following query and analysis statement to count webpage PVs. Then, click Search & Analysis to view the logs.
*| select diff[1] as pv, diff[2] as previous_day_pv, (diff[1] - diff[2])/diff[2] as growth
from (
    select compare(pv, 86400) as diff
    from (
        select count(1) as pv
        from log
    )
)
Step 2: Configure a trend chart
1. Add a trend chart
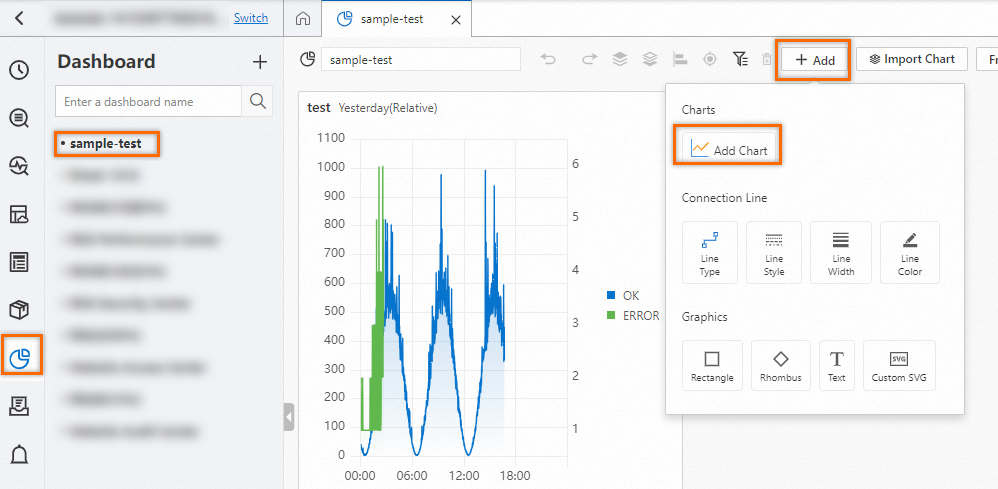
In the navigation pane on the left, choose . In the Dashboard list, click the dashboard that you want to manage. In the upper-right corner of the dashboard, click Edit. In edit mode, choose .
2. Configure a title
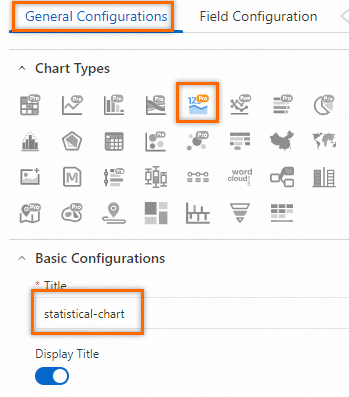
On the right side of the page, choose . Then, under , set Title to statistical-chart.
3. Configure the trend chart
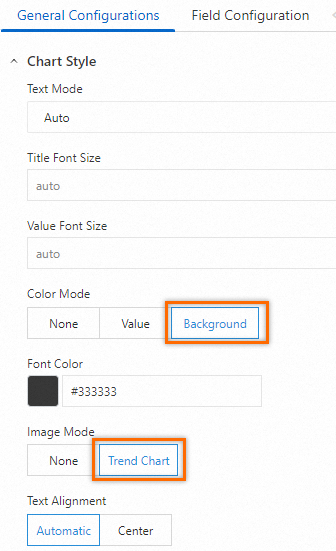
On the right side of the page, set to Background and set to Trend Chart.
: Select Background to specify the color for the background and the trend chart. The default color is green.
: The statistical chart is displayed as a Trend Chart.
4. Configure a comparison value
On the General Configurations tab in the right-side panel, configure the Search & Analysis Settings. On the left side of the page, configure the query time range, Logstore, and query and analysis statement. Then, click Apply at the top of the page to view the chart.
: Select the
PVfield from query A to display it in the trend chart.: Select the
growthfield, which represents the change in value.: Enter
compared to yesterdayas the description for the comparison value.: Set the display format for the comparison value to
percent(1-100)because thegrowthfield represents a rate of change.: Set the number of decimal places to two.

5. Save the trend chart and the dashboard
In the upper-right corner of the chart editing page, click OK.
In the upper-right corner of the dashboard editing page, click Save.
