Simple Log Service (SLS) allows you to add Markdown charts to a dashboard. You can insert multiple elements, such as background information, chart descriptions, page notes, and extended information into Markdown charts to make your dashboard page more informative. This topic describes how to configure a Markdown chart based on query and analysis results.
Prerequisites
Log data is collected. For more information, see Collect text logs from servers.
Indexes are created. For more information, see Create indexes.
A dashboard is created. For more information, see Create a dashboard.
Configuration result preview

Query and analyze logs: Query and analyze logs in the SLS console. The operations involved include log retrieval, log aggregation, and log statistics.
Configure a Markdown chart: Configure a Markdown chart based on the query and analysis results and then add the chart to a dashboard.
Step 1: Query and analyze logs
Log on to the Simple Log Service console. In the Projects section, click the project you want.
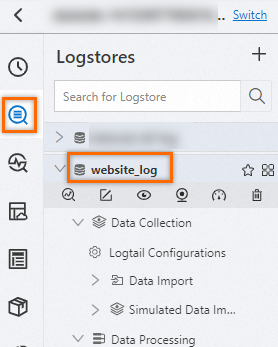
In the left-side navigation pane, click the Log Storage icon. In the Logstores list, click the Logstore that you want to manage.

Enter the following query statements in the input box and click Search & Analyze to check whether logs can be queried as expected.
Query the total number of logs:
* | SELECT COUNT(*) as COUNTQuery the current status with the highest number of service requests and the number of requests:
* | SELECT status, COUNT(*) as c group by status order by c DESC limit 1Query the current status with the highest number of abnormal service requests and the number of requests:
* and status > 400 | SELECT status, COUNT(*) as c group by status order by c DESC limit 1
Step 2: Configure a Markdown chart
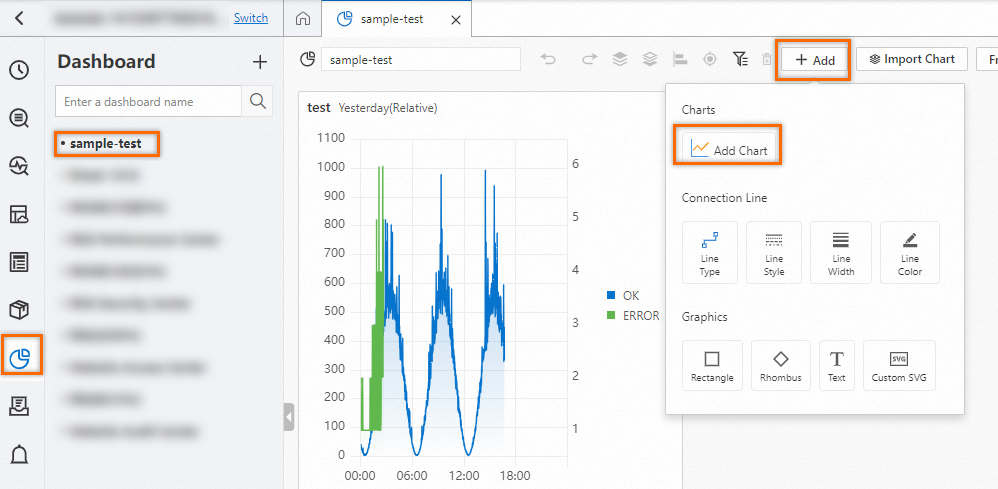
In the left-side navigation pane, move the pointer over the Dashboard icon and then select Dashboards. In the Dashboard list, click the dashboard to which you want to add a chart. In the upper-right corner of the page that appears, click Edit to enter the dashboard edit mode. Click Add and then click Add Chart.

On the right side of the page, click the
 icon in the Chart Types section of the General Configurations tab. On the left side of the page, select a time range and a Logstore, and enter query statements. Then, click Apply to view the chart configuration result. Important
If you add only one query statement, directly use the field name. Example:
${{Field name}}.If you add multiple query statements, add query statement IDs before field names. This helps prevent field name conflicts. Example:
${{Query ID.Field name}}. For information about the limits of query, see the Limits section of the "Query and analysis" topic.
: sets the chart to be horizontally centered.
: sets the chart to be vertically centered.
