Logtail collects Linux systemd journal logs from binary files. Create a Logtail configuration in the Log Service console to collect these logs.
Prerequisites
Logtail 0.16.18 or later for Linux is installed on your server. Install Logtail on a Linux server.
Introduction
systemd is a Linux system and service manager. When running as PID 1, it starts and maintains user-space services and centrally manages logs for all units, including kernel and application logs. The configuration file is typically at /etc/systemd/journald.conf.
The operating system must support the journal log format.
Features
-
Logtail saves checkpoints automatically, so collection resumes after restarts.
-
Filter logs by specified units.
-
Collect kernel logs.
-
Automatically parse log levels.
-
Collect host journal logs in containerized environments such as Docker and Kubernetes.
Use cases
-
Monitor kernel events and automatically trigger alerts for exceptions.
-
Collect all system logs for long-term storage to reduce disk space usage.
-
Collect output logs from software (units) for analysis or alerting.
-
Search journal logs for keywords or entries faster than
journalctl.
Procedure
Log on to the Simple Log Service console.
-
In the Import Data section, select Custom Data Plug-in.
-
Select the destination project and Logstore, and then click Next.
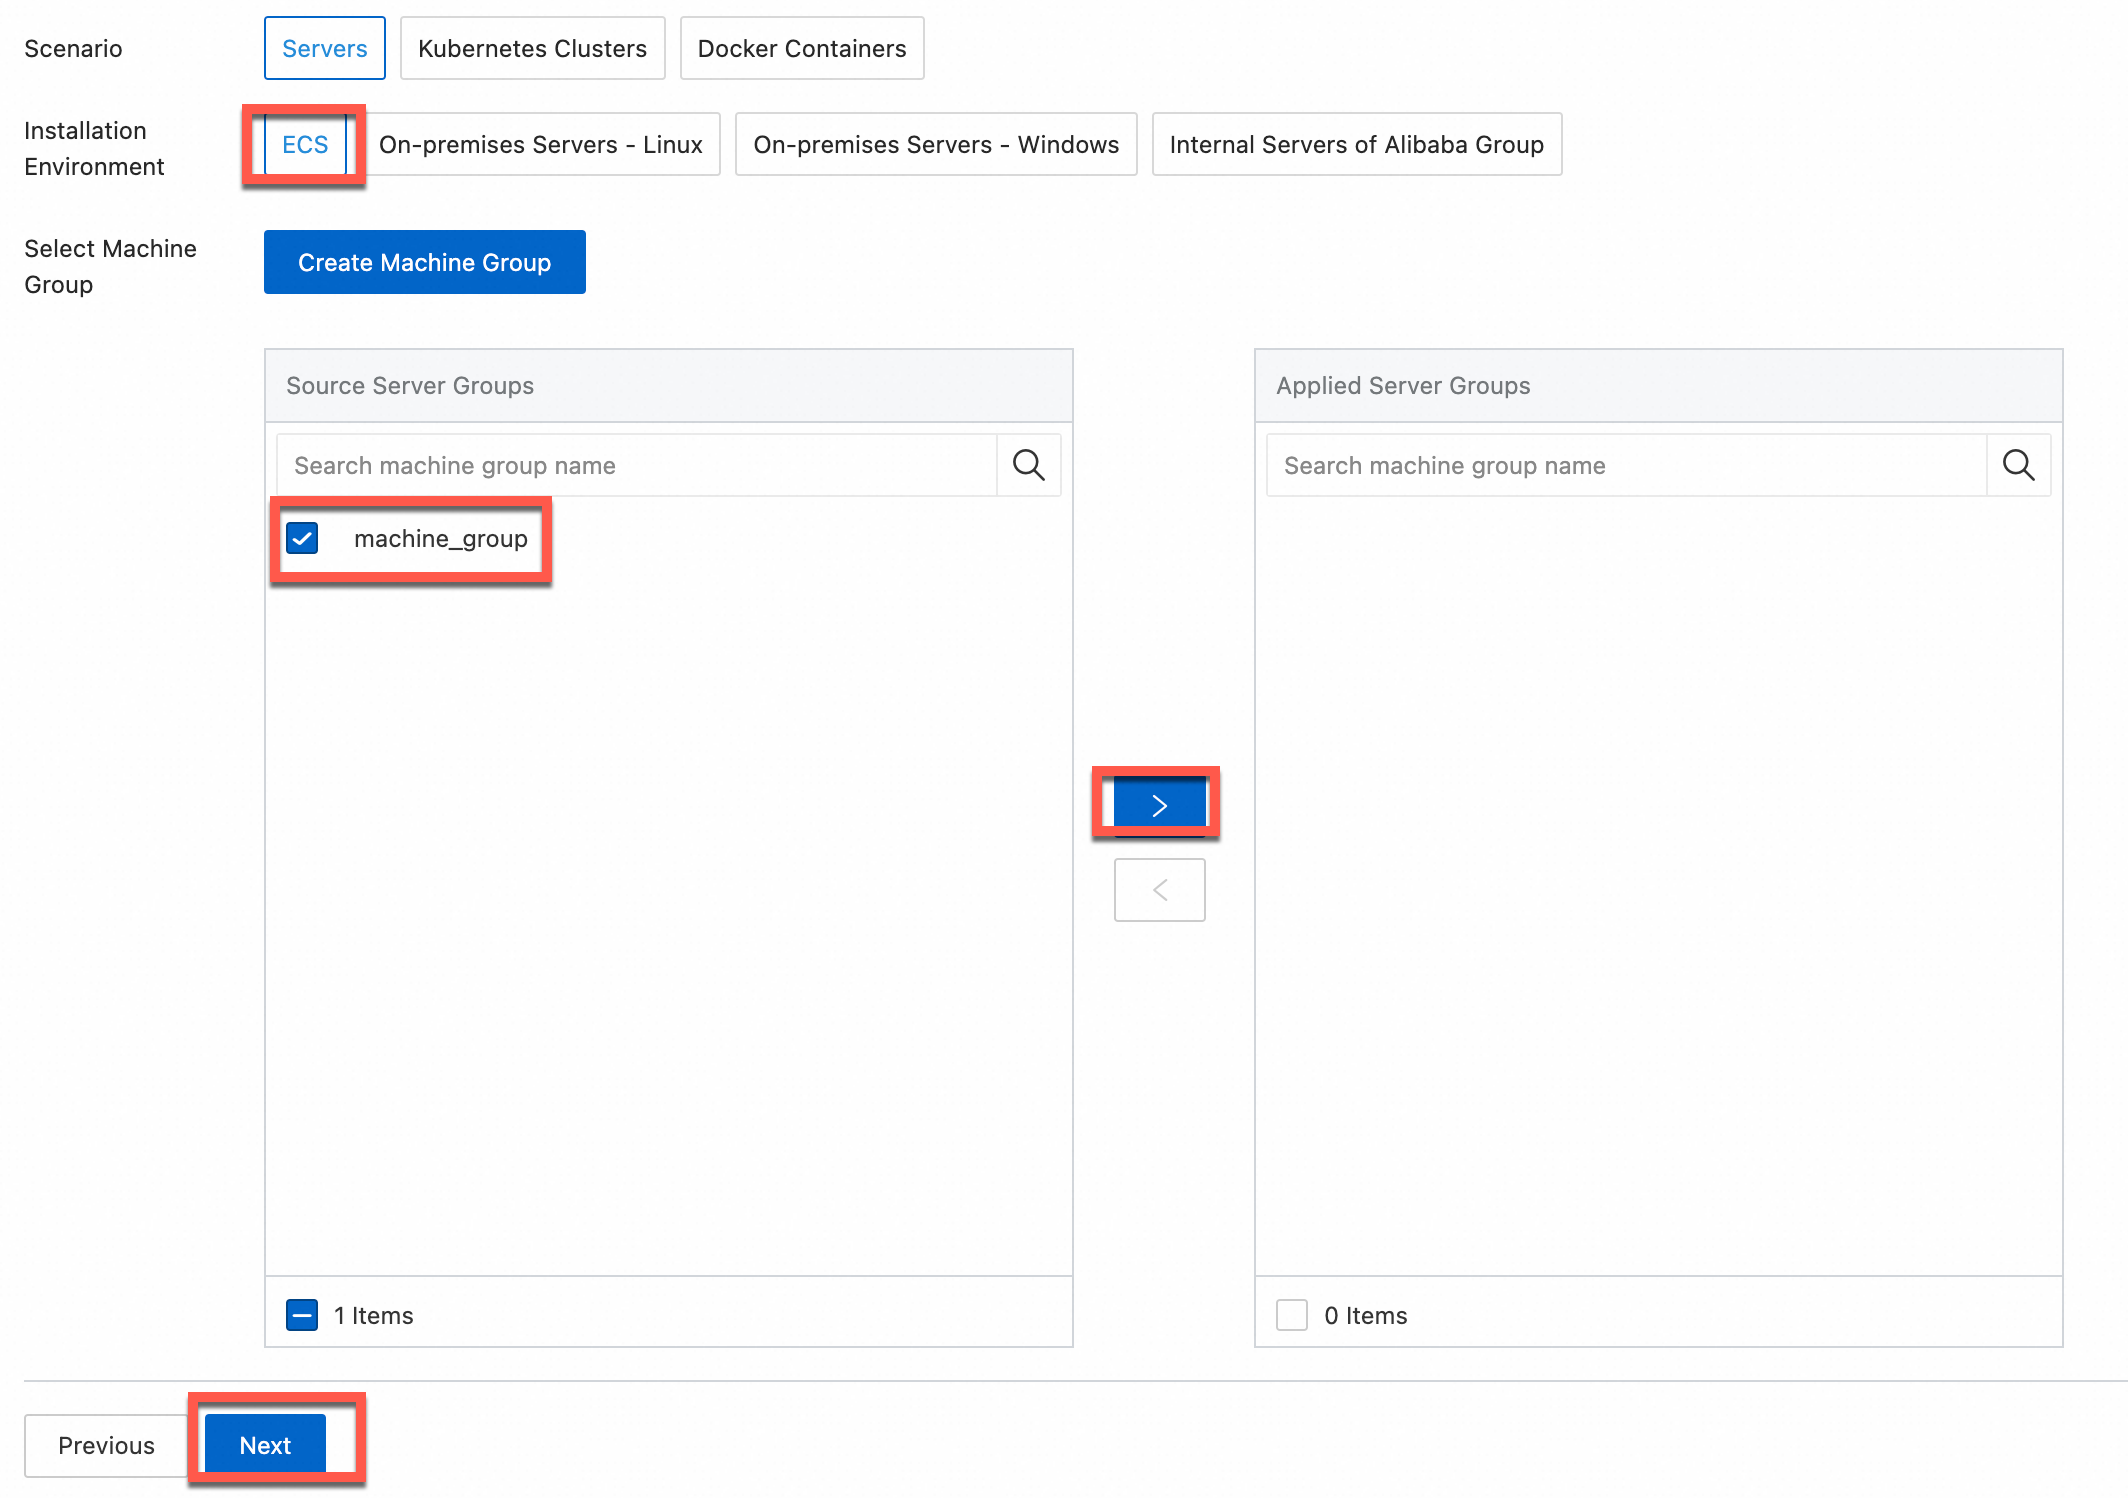
In the Machine Group Configurations step, configure a machine group.
Configure the Scenario and Installation Environment parameters as needed.
ImportantYou must configure the Scenario and Installation Environment parameters regardless of whether a machine group is available. The parameter settings affect subsequent configurations.
Ensure that a machine group is displayed in the Applied Server Groups section, and click Next.
Machine group available
Select a machine group from the Source Machine Group section.
No machine group available
Click Create Machine Group. In the Create Machine Group panel, configure the parameters. You can set the Machine Group Identifier parameter to IP Address or Custom Identifier. For more information, see Create a custom identifier-based machine group or Create an IP address-based machine group.
ImportantIf you apply a machine group immediately after you create the machine group, the heartbeat status of the machine group may be FAIL. This issue occurs because the machine group is not connected to Simple Log Service. To resolve this issue, you can click Automatic Retry. If the issue persists, see What do I do if no heartbeat connections are detected on Logtail?
-
On the Data Source Settings tab, set the Configuration Name and Plug-in Configuration, then click Next.
-
inputs is required and is used to configure the data source settings for the Logtail configuration.
ImportantYou can specify only one type of data source in inputs.
-
processors is optional and is used to configure the data processing settings for the Logtail configuration to parse data. You can specify one or more processing methods.
If your logs cannot be parsed based only on the setting of inputs, you can configure processors in the Plug-in Configuration field to add plugins for data processing. For example, extract fields, extract log time, mask data, and filter logs. For more information, see Logtail plugins for data processing.
{
  "inputs": [
    {
      "detail": {
        "JournalPaths": [
          "/var/log/journal"
        ],
        "Kernel": true,
        "ParsePriority": true,
        "ParseSyslogFacility": true
      },
      "type": "service_journal"
    }
  ]
}
Parameter
Type
Required
Description
type
String
Yes
The data source type. Set to
service_journal.JournalPaths
Array of strings
Yes
Systemd journal directory paths. Example: /var/log/journal.
SeekPosition
String
No
Initial collection start position. Valid values:
headandtail. Default value:tail.-
head: Collect all existing log data from the beginning. -
tail: Collect only new log data generated after the configuration is applied.
Kernel
Boolean
No
Collect kernel logs. Default:
true.Units
Array of strings
No
Units to collect logs from. If empty, Logtail collects from all units.
ParseSyslogFacility
Boolean
No
Parse the
facilityfield from syslog logs. Default:false.ParsePriority
Boolean
No
Parse the
Priorityfield. Default:false.When set to true, the Priority field maps as follows.
  "0": "emergency"
  "1": "alert"
  "2": "critical"
  "3": "error"
  "4": "warning"
  "5": "notice"
  "6": "informational"
  "7": "debug"
UseJournalEventTime
Boolean
No
Use the journal log entry timestamp as the log time. Default:
false(uses collection time).For real-time collection, the journal timestamp and collection time typically differ by less than 3 seconds.
-
Create indexes and preview data. Then, click Next. By default, full-text indexing is enabled in Simple Log Service. You can also manually create field indexes for the collected logs or click Automatic Index Generation. Then, Simple Log Service generates field indexes. For more information, see Create indexes.
ImportantIf you want to query all fields in logs, we recommend that you use full-text indexes. If you want to query only specific fields, we recommend that you use field indexes. This helps reduce index traffic. If you want to analyze fields, you must create field indexes. You must include a SELECT statement in your query statement for analysis.
Click Query Log. Then, you are redirected to the query and analysis page of your Logstore.
You must wait approximately 1 minute for the indexes to take effect. Then, you can view the collected logs on the Raw Logs tab. For more information about how to query and analyze logs, see Query and analysis quick start.
Examples
-
Example 1
Collect journal logs from the default directory
/var/log/journal. The following configuration is used:{ "inputs": [ { "detail": { "JournalPaths": [ "/var/log/journal" ] }, "type": "service_journal" } ] }Log sample:
MESSAGE: rejected connection from "192.168.0.250:43936" (error "EOF", ServerName "") PACKAGE: embed PRIORITY: 6 SYSLOG_IDENTIFIER: etcd _BOOT_ID: fe919cd1268f4721bd87b5c18afe59c3 _CAP_EFFECTIVE: 0 _CMDLINE: /usr/bin/etcd --election-timeout=3000 --heartbeat-interval=500 --snapshot-count=50000 --data-dir=data.etcd --name 192.168.0.251-name-3 --client-cert-auth --trusted-ca-file=/var/lib/etcd/cert/ca.pem --cert-file=/var/lib/etcd/cert/etcd-server.pem --key-file=/var/lib/etcd/cert/etcd-server-key.pem --peer-client-cert-auth --peer-trusted-ca-file=/var/lib/etcd/cert/peer-ca.pem --peer-cert-file=/var/lib/etcd/cert/192.168.0.251-name-3.pem --peer-key-file=/var/lib/etcd/cert/192.168.0.251-name-3-key.pem --initial-advertise-peer-urls https://192.168.0.251:2380 --listen-peer-urls https://192.168.0.251:2380 --advertise-client-urls https://192.168.0.251:2379 --listen-client-urls https://192.168.0.251:2379 --initial-cluster 192.168.0.249-name-1=https://192.168.0.249:2380,192.168.0.250-name-2=https://192.168.0.250:2380,192.168.0.251-name-3=https://192.168.0.251:2380 --initial-cluster-state new --initial-cluster-token abac64c8-baab-4ae6-8412-4253d3cfb0cf _COMM: etcd _EXE: /opt/etcd-v3.3.8/etcd _GID: 995 _HOSTNAME: iZbp1f7y2ikfe4l8nx95amZ _MACHINE_ID: f0f31005fb5a436d88e3c6cbf54e25aa _PID: 10926 _SOURCE_REALTIME_TIMESTAMP: 1546854068863857 _SYSTEMD_CGROUP: /system.slice/etcd.service _SYSTEMD_SLICE: system.slice _SYSTEMD_UNIT: etcd.service _TRANSPORT: journal _UID: 997 __source__: 172.16.1.4 __tag__:__hostname__: logtail-ds-8kqb9 __topic__: _monotonic_timestamp_: 1467135144311 _realtime_timestamp_: 1546854068864309 -
Example 2
NoteLimitations on collecting host journal logs from a container:
-
A container with systemd version 247 or earlier cannot collect journal logs from a host that runs systemd version 249 or later.
-
A container with systemd version 249 or later can read logs in both old and new formats.
In a Kubernetes environment, use DaemonSet mode to collect host system logs. Use processing plug-ins to retain only important fields. Example configuration:
{
  "inputs": [
    {
      "detail": {
        "JournalPaths": [
          "/logtail_host/var/log/journal"
        ],
        "ParsePriority": true,
        "ParseSyslogFacility": true
      },
      "type": "service_journal"
    }
  ],
  "processors": [
    {
      "detail": {
        "Exclude": {
          "UNIT": "^libcontainer.*test"
        }
      },
      "type": "processor_filter_regex"
    },
    {
      "detail": {
        "Include": [
          "MESSAGE",
          "PRIORITY",
          "_EXE",
          "_PID",
          "_SYSTEMD_UNIT",
          "_realtime_timestamp_",
          "_HOSTNAME",
          "UNIT",
          "SYSLOG_FACILITY",
          "SYSLOG_IDENTIFIER"
        ]
      },
      "type": "processor_pick_key"
    }
  ]
}
Log sample:
MESSAGE: rejected connection from "192.168.0.251:48914" (error "EOF", ServerName "") PRIORITY: informational SYSLOG_IDENTIFIER: etcd _EXE: /opt/etcd-v3.3.8/etcd _HOSTNAME: iZbp1i0czq3zgvxlx7u8ueZ _PID: 10590 _SYSTEMD_UNIT: etcd.service __source__: 172.16.0.141 __tag__:__hostname__: logtail-ds-dp48x __topic__: _realtime_timestamp_: 1547975837008708 -
Troubleshooting
If no data appears on the preview or query page after you configure Logtail to collect logs, see Troubleshoot Logtail collection failures.