Create a Logtail configuration in the SLS console to collect Syslog data from Linux servers.
How it works
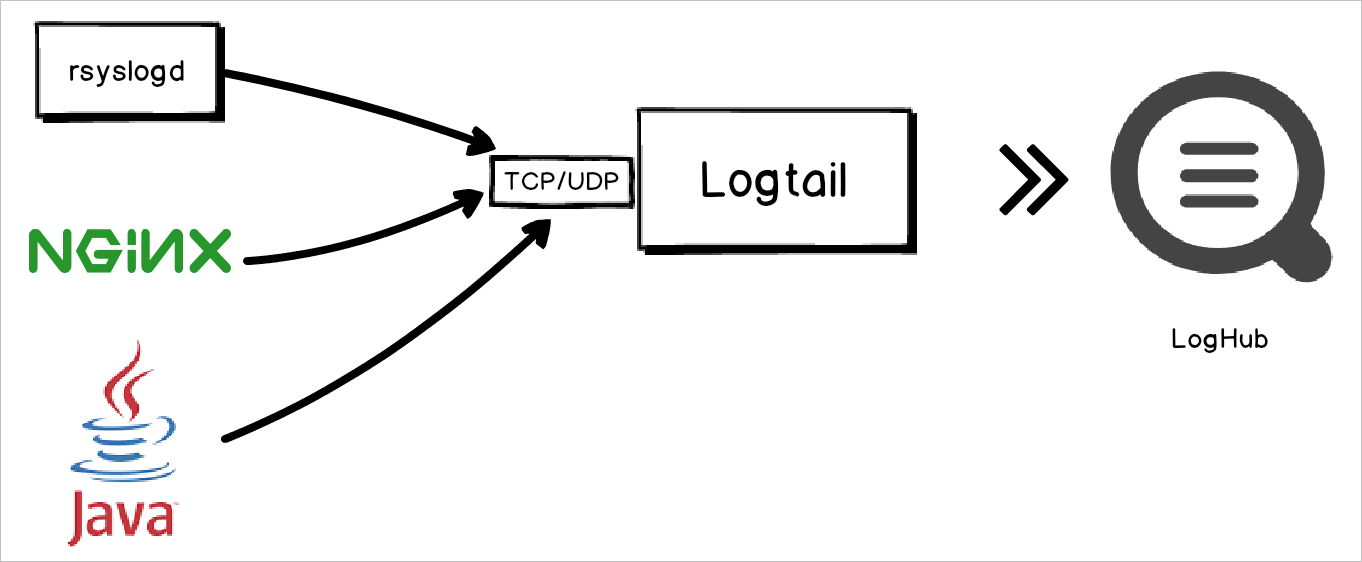
On a Linux server, a Syslog agent such as rsyslog forwards local Syslog data to a specified IP address and port. Logtail listens on that address and port, receives data over TCP or UDP, and parses it per the configured Syslog protocol to extract fields such as facility, tag (program), severity, and content.
Syslog supports the protocols defined in RFC 3164 and RFC 5424.
Prerequisites
A project and a Standard logstore are created. For more information, see Manage projects and Create a basic LogStore.
This feature supports only Linux and requires the latest Logtail version. Install Logtail on a Linux server.
Procedure
The following steps use an ECS instance as an example.
Log on to the Simple Log Service console.
In the Import Data section, select Custom Data Plug-in.
-
Select the project and logstore. Then, click Next.
-
Create a machine group.
-
If a machine group is available, click Use Existing Machine Groups.
-
If no machine groups are available, perform the following steps to create a machine group. In this example, an Elastic Compute Service (ECS) instance is used.
-
On the ECS Instance tab, select Manually Select Instances. Then, select the ECS instance that you want to use and click Create.
For more information, see Install Logtail on ECS instances.
ImportantIf your server is an ECS instance that belongs to a different Alibaba Cloud account from Simple Log Service, a server in a data center, or a server from a third-party cloud service provider, you must manually install Logtail on the server. For more information, see Install Logtail on a Linux server or Install Logtail on a Windows server. After you manually install Logtail, you must configure a user identifier for the server. For more information, see Configure a user identifier.
-
After you confirm the settings, click OK.
-
After Logtail is installed, click Complete Installation.
-
In the Create Machine Group step, configure the Name parameter and click Next.
Simple Log Service allows you to create IP address-based machine groups and custom identifier-based machine groups. For more information, see Create an IP address-based machine group and Create a custom identifier-based machine group.
-
-
-
Confirm that the machine group is displayed in the Applied Server Groups section and click Next.
ImportantIf you apply a machine group immediately after you create the machine group, the heartbeat status of the machine group may be FAIL. This issue occurs because the machine group is not connected to Simple Log Service. To resolve this issue, you can click Automatic Retry. If the issue persists, see What do I do if no heartbeat connections are detected on Logtail?
On the Configure Data Source tab, set Configuration Name, copy and paste the following script into the Plug-in Configuration field, and then click Next.
{
     "inputs": [
         {
             "type": "service_syslog",
             "detail": {
                 "Address": "tcp://0.0.0.0:9000",
                 "ParseProtocol": "rfc3164"
             }
         },
         {
             "type": "service_syslog",
             "detail": {
                 "Address": "udp://0.0.0.0:9001",
                 "ParseProtocol": "rfc3164"
             }
         }
     ]
 }
Parameters:
Parameter
Type
Required
Description
typestring
Yes
The data source type. Set to
service_syslog.Addressstring
No
The listening endpoint. Format:
[tcp/udp]://[ip]:[port]. Default:tcp://127.0.0.1:9999(local server only).NoteThe protocol, address, and port number specified in the Logtail configuration must match the forwarding rule in your rsyslog configuration file.
If the server where Logtail is installed has multiple IP addresses that can receive logs, you can set the address to
0.0.0.0to listen on all IP addresses of the server.
ParseProtocolstring
No
The parsing protocol. Default: empty (no parsing). Valid values:
Empty: Logs are not parsed.
rfc3164: Logs are parsed using the RFC 3164 protocol.
rfc5424: Logs are parsed using the RFC 5424 protocol.
auto: A suitable protocol is automatically selected based on the log content.
IgnoreParseFailureboolean
No
Action when parsing fails. Default:
true(skip parsing and write the raw log to thecontentfield). Set tofalseto drop unparseable logs.AutoConfigRsyslogboolean
No
Specifies whether to automatically configure rsyslog forwarding. Default:
false. When set totrue,LoongCollectorautomatically creates a forwarding configuration file in/etc/rsyslog.d/and restarts rsyslogd. RequiresLoongCollector3.3.9 or later. IfLoongCollectorruns as a non-root user, this feature is automatically skipped and a warning log is output. Normal log collection is not affected.RsyslogFiltersstring[]
No
Specifies rsyslog forwarding rules to filter which facility and severity levels of logs to collect. Uses standard rsyslog filter syntax (
facility.severity). Default:*.*(all logs). Example:["auth.warning","authpriv.warning","kern.err","daemon.info"]. Takes effect only whenAutoConfigRsyslogis set totrue.ImportantRoot permissions required — Writing to
/etc/rsyslog.d/and restarting rsyslogd require root permissions. IfLoongCollectorruns as a non-root user, this feature is automatically skipped and a warning log is output. Normal log collection is not affected.Disabled by default —
AutoConfigRsyslogdefaults tofalseand does not change existing behavior. The feature is activated only when explicitly set totrue.Configuration updates — When
AddressorRsyslogFilterschanges,LoongCollectorautomatically updates the rsyslog forwarding configuration and restarts rsyslogd. If the new and existing configurations are identical, the restart is skipped to avoid unnecessary service disruptions.Relationship with manual configuration — If you have already manually configured rsyslog forwarding, remove the manual configuration before enabling
AutoConfigRsyslogto prevent duplicate log forwarding.Multiple collection configurations — Multiple
service_syslogcollection configurations can simultaneously haveAutoConfigRsyslogenabled. Each configuration generates a separate rsyslog forwarding configuration file (the file name contains theconfigName). These files do not conflict with each other.Only rsyslogd is supported — Automatic configuration and restart are supported only for rsyslogd. Other syslog forwarding daemons such as syslog-ng are not supported.
Forwarding configuration details
Automatically generated rsyslog forwarding configuration files follow this naming convention:
10-loongcollector-{configName}.conf10- prefix — Controls the rsyslog file loading order. Files in
/etc/rsyslog.d/are loaded in alphabetical order. The10-prefix ensures forwarding rules are loaded before the system default rules (typically50-default.conf), so logs are forwarded before local rules are applied. Forwarding rules do not block subsequent rules (such as local file writes).{configName} — Corresponds to the
LoongCollectorcollection configuration name. Multiple collection configurations can simultaneously enable automatic forwarding without conflicts.File permissions —
0644(owner: root, readable by other users), consistent with existing files under/etc/rsyslog.d/.
rsyslog restart scenarios
The following table shows whether rsyslogd is restarted under each scenario when
AutoConfigRsyslogis enabled.Scenario
rsyslog restarted
Initial delivery of collection configuration
Yes
Configuration change with differences (Address protocol, IP, or port changed; or
RsyslogFilterschanged)Yes
Configuration change without differences (content unchanged)
No
Collection configuration removed
Yes
LoongCollectorexitsNo (the forwarding configuration is retained; rsyslog uses its queue to buffer logs, and forwarding resumes automatically after
LoongCollectorrestarts)On the Query and Analysis Configurations tab, click Automatic Index Generation. No data is collected at this point. Click Next to complete the Logtail configuration.
View the collected Syslog data in the destination Logstore. Quick start for query and analysis.
Log fields
Field | Description |
| Defaults to the current host's hostname if not provided in the log. |
| The tag field from the Syslog protocol. |
| The priority field from the Syslog protocol. |
| The facility field from the Syslog protocol. |
| The severity field from the Syslog protocol. |
| The timestamp of the log. |
| The content of the log. If parsing fails, this field contains the full content of the raw log. |
| The IP address of the current host. |
| The IP address of the client that sends the log. |
More examples
Nginx logs
Nginx natively supports forwarding access logs via the Syslog protocol. To centrally collect all server data, including Nginx access logs, in SLS via Syslog, create a Logtail configuration.
Create a Logtail configuration as described in Collect Linux Syslog.
The following code shows a sample Plug-in Configuration script.
{
     "inputs": [
         {
             "type": "service_syslog",
             "detail": {
                 "Address": "udp://127.0.0.1:9001",
                 "ParseProtocol": "rfc3164"
             }
         }
     ]
 }
Add a forwarding rule for Nginx.
Add a forwarding rule to nginx.conf. The official Nginx documentation covers the configuration structure.
Example:
server {
    ...

    # Add this line.
    access_log syslog:server=127.0.0.1:9001,facility=local7,tag=nginx,severity=info combined;

    ...
}
Run the following command to restart the Nginx service for the configuration to take effect.
sudo service nginx restart
Firewall logs
Firewalls typically support forwarding logs via the Syslog protocol. To centrally collect firewall logs in SLS (for example, to build a SIEM), create a Logtail configuration.
Create a Logtail configuration as described in Collect Linux Syslog.
The following code shows a sample Plug-in Configuration script.
{
     "inputs": [
         {
             "type": "service_syslog",
             "detail": {
                 "Address": "udp://0.0.0.0:9001",
                 "ParseProtocol": "rfc3164"
             }
         }
     ]
 }
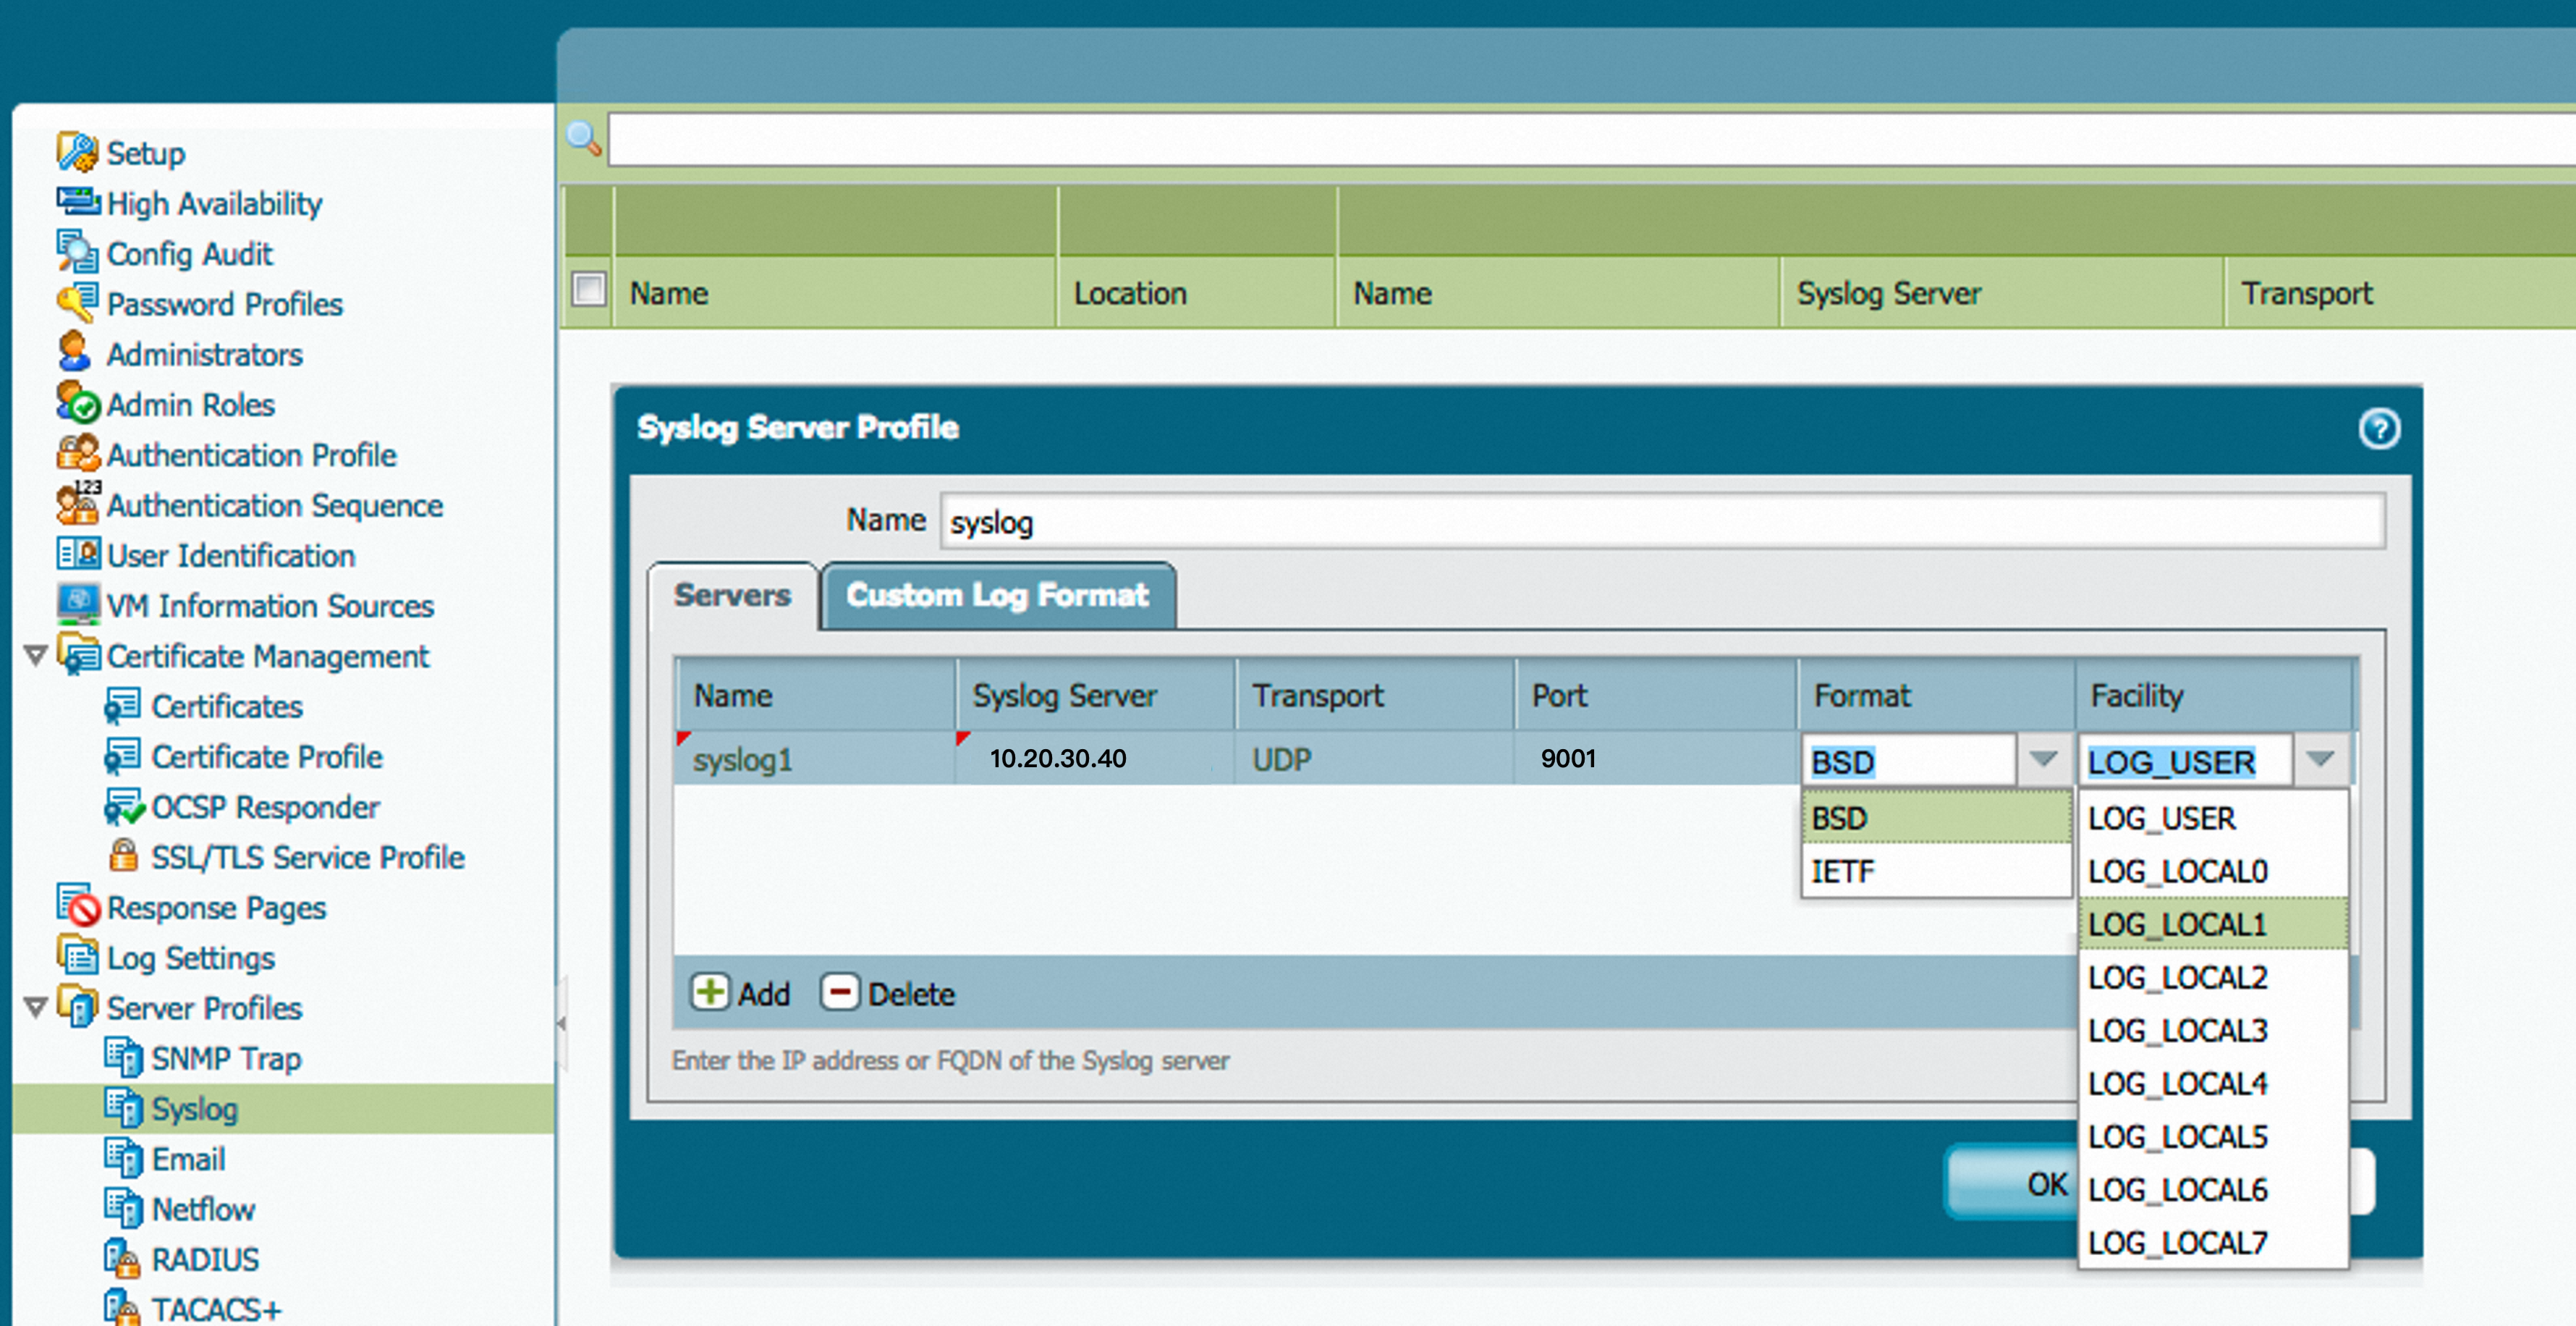
Add a forwarding rule per your firewall's documentation. In this example, the Logtail server IP is 10.20.30.40.
Troubleshooting
If no data appears after configuring Logtail, run the logger command to send test data to the local Logtail instance. This isolates whether the issue is with the data source, the network, or Logtail.
If the local Logtail instance receives the data, the issue is likely with the data source or the network.
logger -n localhost -P 9000 -T "This is a TCP syslog message"
logger -n localhost -P 9001 -d "This is a UDP syslog message"Collect auditd audit logs
auditd is the daemon process of the Linux audit system. By default, auditd writes audit logs to /var/log/audit/audit.log. You can use the Logtail text log collection feature to collect auditd audit logs to Simple Log Service (SLS).
Prerequisites
auditd is installed. On Ubuntu, run
apt-get install auditd. On CentOS, runyum install audit.A project and a LogStore are created.
Logtail is installed and a machine group is created.
Procedure
In the SLS console, go to the destination LogStore and create a Logtail configuration.
Select the text log collection mode.
Set the log path to
/var/log/audit/audit.log.Select the full regex mode, and set the regular expression to
(.*)so that each line of the log is collected as thecontentfield.
auditd log format
Each line of an auditd log starts with type= (for example, type=SYSCALL or type=USER_ACCT) and contains msg=audit(timestamp:serial number), along with fields such as pid, uid, auid, and ses.
References
Upload logs using the Syslog protocol describes how to use Syslog-ng to upload logs over TLS-encrypted connections in RFC 5424 format. rsyslog and Syslog-ng cannot run at the same time. If you want to use Syslog-ng, uninstall rsyslog first.