Create a Logtail configuration in the Log Service console to collect PostgreSQL query results.
Prerequisites
-
Logtail 0.16.0 or later for Linux, or Logtail 1.0.0.8 or later for Windows, is installed on a server. For more information, see Install Logtail (Linux) or Install Logtail (Windows).
ImportantEnsure the server where Logtail is installed can connect to the destination database.
-
The IP address of the server where Logtail is installed has been added to the whitelist of the PostgreSQL database.
For example, to configure a whitelist for an RDS for PostgreSQL database, see Configure a whitelist.
Features
-
Collect query results from a PostgreSQL database.
-
Pagination.
-
Time zone settings.
-
Timeout settings.
-
Checkpoint state persistence.
-
Configurable maximum number of records collected per run.
Procedure
Log on to the Simple Log Service console.
-
In the Import Data section, select Custom Data Plug-in.
-
Select the destination project and Logstore, and then click Next.
In the Machine Group Configurations step, configure a machine group.
Configure the Scenario and Installation Environment parameters as needed.
ImportantYou must configure the Scenario and Installation Environment parameters regardless of whether a machine group is available. The parameter settings affect subsequent configurations.
Ensure that a machine group is displayed in the Applied Server Groups section, and click Next.
Machine group available
Select a machine group from the Source Machine Group section.
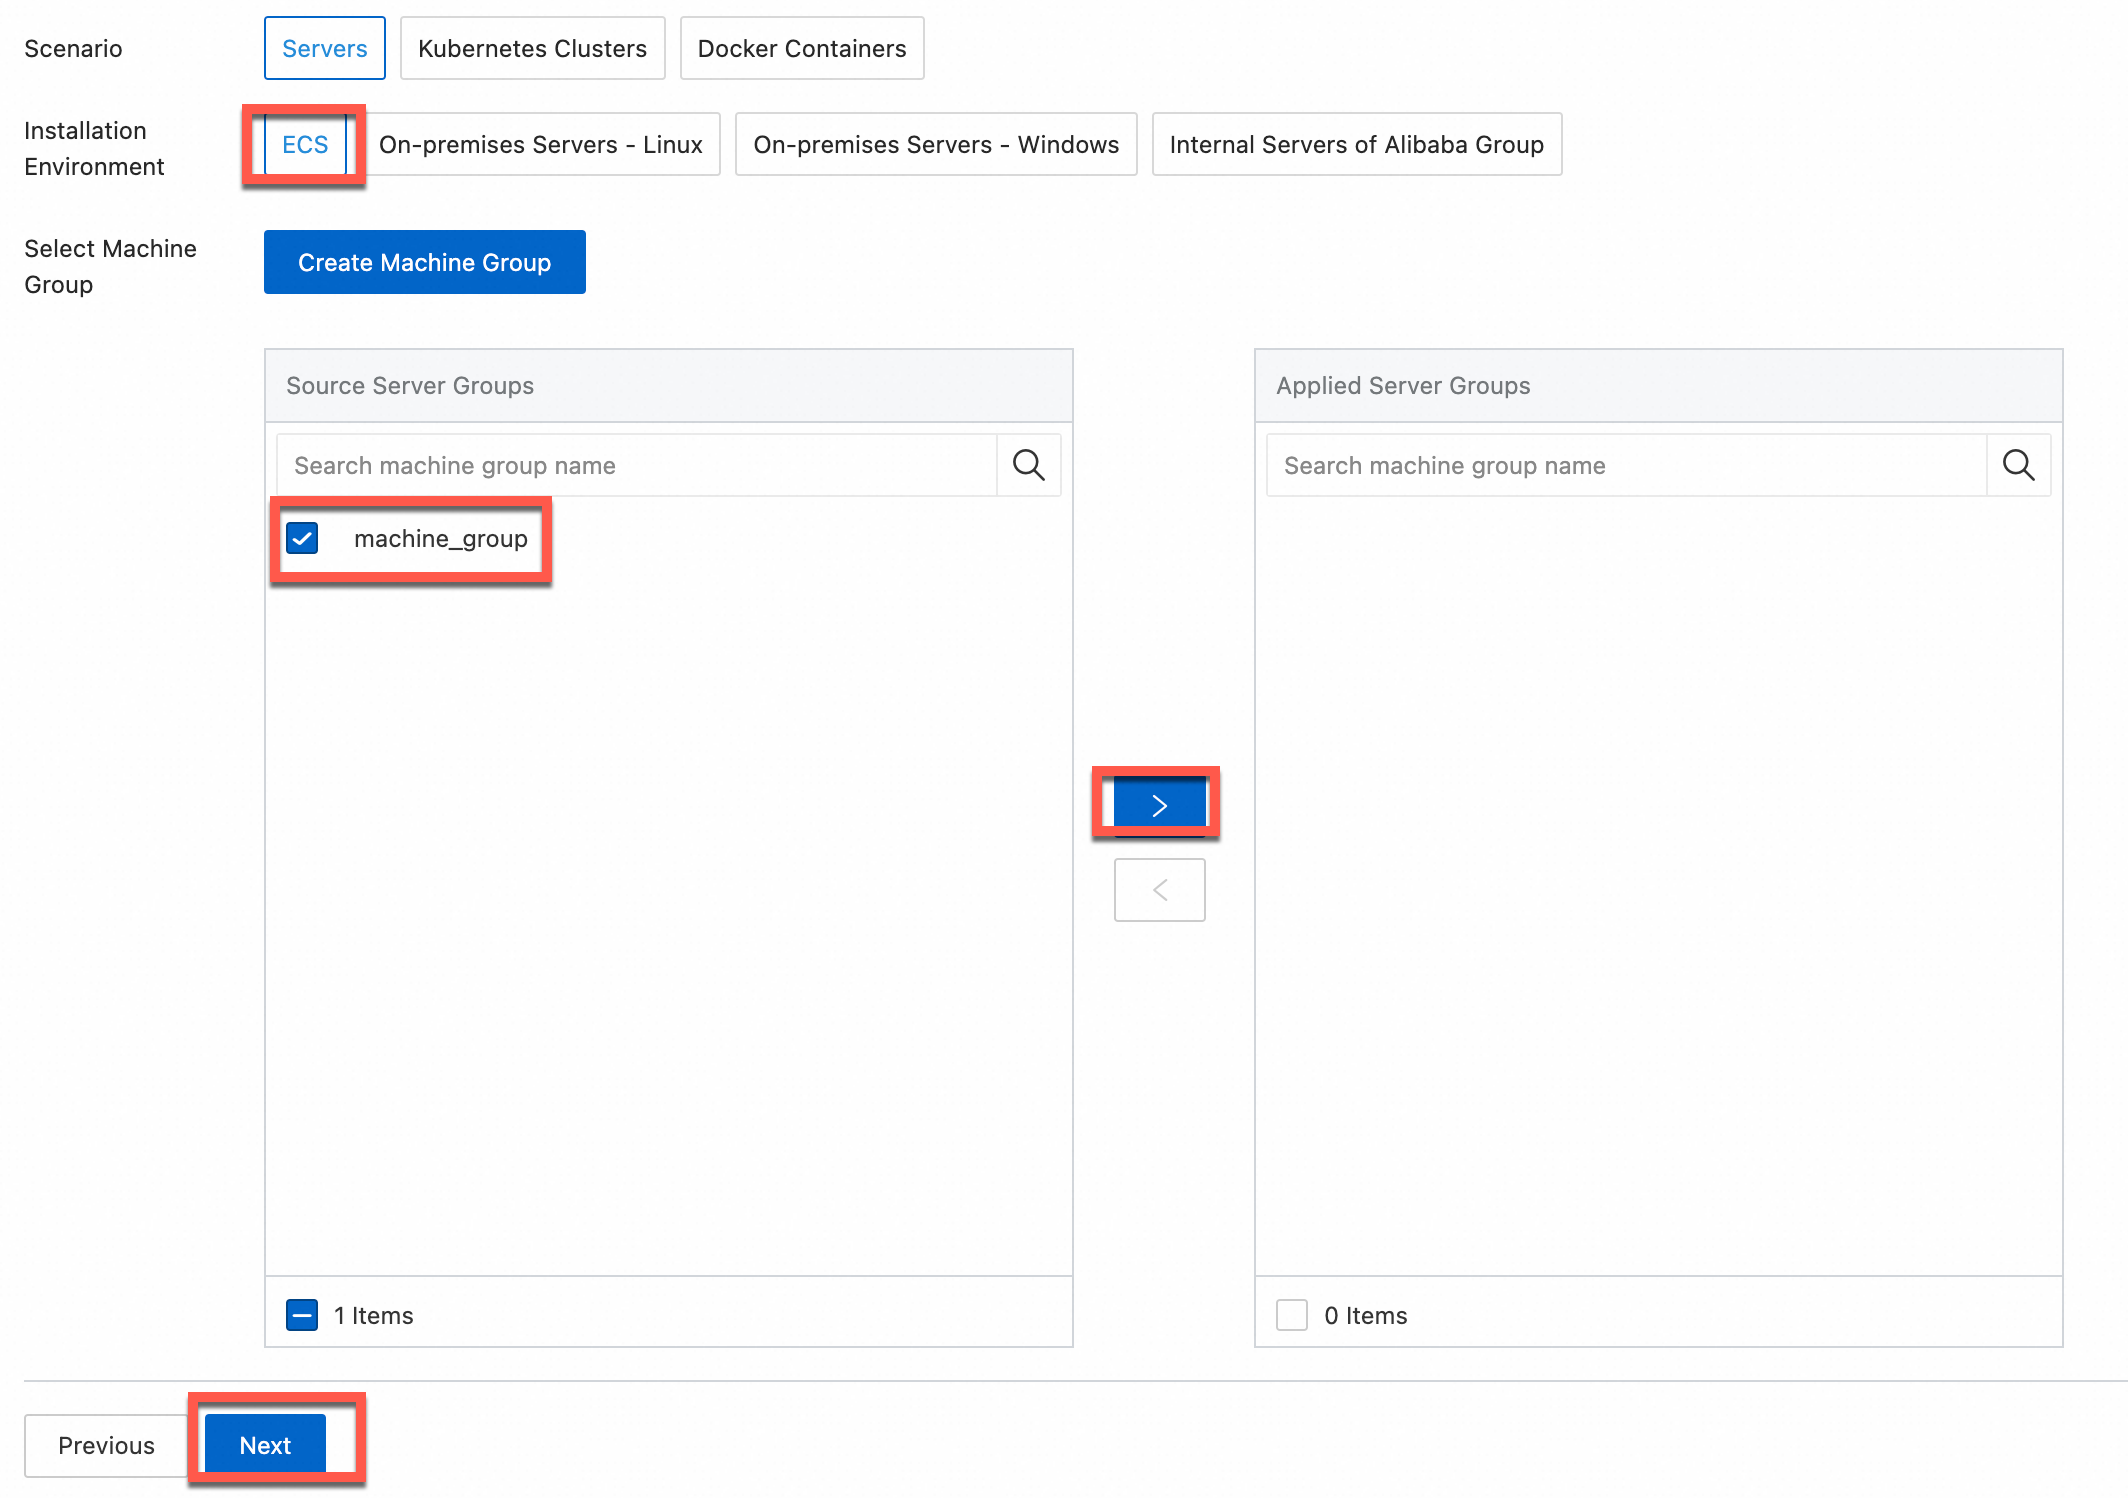
No machine group available
Click Create Machine Group. In the Create Machine Group panel, configure the parameters. You can set the Machine Group Identifier parameter to IP Address or Custom Identifier. For more information, see Create a custom identifier-based machine group or Create an IP address-based machine group.
ImportantIf you apply a machine group immediately after you create the machine group, the heartbeat status of the machine group may be FAIL. This issue occurs because the machine group is not connected to Simple Log Service. To resolve this issue, you can click Automatic Retry. If the issue persists, see What do I do if no heartbeat connections are detected on Logtail?
-
On the Configure Data Source tab, set Configuration Name and Plug-in Configuration, and then click Next.
-
inputs is required and is used to configure the data source settings for the Logtail configuration.
ImportantYou can specify only one type of data source in inputs.
-
processors is optional and is used to configure the data processing settings for the Logtail configuration to parse data. You can specify one or more processing methods.
If your logs cannot be parsed based only on the setting of inputs, you can configure processors in the Plug-in Configuration field to add plugins for data processing. For example, extract fields, extract log time, mask data, and filter logs. For more information, see Logtail plugins for data processing.
{
  "inputs": [
    {
      "type": "service_pgsql",
      "detail": {
        "Address": "pgm-****.pg.rds.aliyuncs.com",
        "User": "****",
        "Password": "*******",
        "DataBase": "****",
        "Limit": true,
        "PageSize": 100,
        "StateMent": "select * from specialalarmtest where id > $1 order by id",
        "CheckPoint": true,
        "CheckPointColumn": "id",
        "CheckPointStart": "0",
        "CheckPointSavePerPage": true,
        "CheckPointColumnType": "int",
        "IntervalMs": 1000
      }
    }
  ]
}
Parameter
Type
Required
Description
type
string
Yes
The data source type. Set the value to service_pgsql.
Address
string
No
The PostgreSQL database endpoint. Example:
pgm-****.pg.rds.aliyuncs.com.Default value: 127.0.0.1:5432.
User
string
No
The username for the PostgreSQL database.
Default value: root.
Password
string
No
The password for the specified username. If not configured, no password is used.
For sensitive credentials, we recommend that you set the username and password to
xxx. After the Logtail configuration is synchronized to the local machine, find the configuration in the local file /usr/local/ilogtail/user_log_config.json and update it. For more information, see Modify a local configuration.ImportantIf you modify this parameter in the console, the change overwrites the local configuration during synchronization.
DataBase
string
No
The PostgreSQL database name.
DialTimeOutMs
int
No
The connection timeout for the PostgreSQL database. Unit: milliseconds (ms).
Default value: 5,000 ms.
ReadTimeOutMs
int
No
The read timeout for query results from the PostgreSQL database. Unit: ms.
Default value: 5,000 ms.
StateMent
string
No
The SELECT statement.
If you set CheckPoint to true, the WHERE clause of the SELECT statement in StateMent must include the checkpoint column (the CheckPointColumn parameter) and set its value to $1. Example: If you set CheckPointColumn to id, set StateMent to
SELECT * from ... where id > $1.Limit
boolean
No
Whether to use LIMIT for pagination.
Default value: false (pagination disabled).
We recommend that you enable pagination. If you set Limit to true, a LIMIT clause is automatically appended to StateMent when the SQL query is executed.
PageSize
int
No
The page size. Required when Limit is set to true.
MaxSyncSize
int
No
The maximum number of records collected per run.
Default value: 0 (no limit).
CheckPoint
boolean
No
Whether to use a checkpoint.
Default value: false.
CheckPointColumn
string
No
The checkpoint column name.
This parameter is required when CheckPoint is set to true.
WarningThe values in this column must be incremental. Otherwise, data loss can occur during collection. The maximum value from each query result is used as the input for the next query.
CheckPointColumnType
string
No
The data type of the checkpoint column. Valid values:
intandtime. Theinttype is stored as int64. Thetimetype supports PostgreSQL time data types.This parameter is required when CheckPoint is set to true.
CheckPointStart
string
No
The initial checkpoint value.
This parameter is required when CheckPoint is set to true.
CheckPointSavePerPage
boolean
No
Whether to save the checkpoint after each page is collected.
-
true: Save the checkpoint after each page.
-
false: Save the checkpoint after each collection cycle.
IntervalMs
int
Yes
The collection interval. Unit: ms.
-
Create indexes and preview data. Then, click Next. By default, full-text indexing is enabled in Simple Log Service. You can also manually create field indexes for the collected logs or click Automatic Index Generation. Then, Simple Log Service generates field indexes. For more information, see Create indexes.
ImportantIf you want to query all fields in logs, we recommend that you use full-text indexes. If you want to query only specific fields, we recommend that you use field indexes. This helps reduce index traffic. If you want to analyze fields, you must create field indexes. You must include a SELECT statement in your query statement for analysis.
-
Click Query Log to go to the Query & Analysis page for the Logstore.
You may need to wait about one minute for the indexes to become effective. You can then view the collected logs on the Raw Logs tab. For more information, see Quick start for log query and analysis.
Modify a local configuration
If you did not enter actual values for parameters such as Address, User, and Password in Plug-in Configuration, you can modify them manually after the Logtail configuration is applied to the server.
Linux
-
Log on to the server where Logtail is installed.
-
Open the /usr/local/ilogtail/user_log_config.json file, search for service_pgsql, and then modify fields such as Address, User, and Password.
-
Run the following command to restart Logtail.
sudo /etc/init.d/ilogtaild stop; sudo /etc/init.d/ilogtaild start
Windows
-
Log on to the server where Logtail is installed.
-
Open the C:\Program Files\Alibaba\Logtail\user_log_config.json file, search for service_pgsql, and then modify fields such as Address, User, and Password.
The file path is different for 64-bit and 32-bit Windows operating systems. For more information, see File paths.
-
Restart Logtail:
Choose .
In the Services dialog box, select the service that you want to manage.
For Logtail V0.x.x.x, select LogtailWorker.
For Logtail V1.0.0.0 or later, select LogtailDaemon.
Right-click the service and select Start, Stop, or Restart.
Troubleshooting
If no data appears on the preview or query page after you configure Logtail to collect logs, see Troubleshoot Logtail collection failures.
Sample database table and logs
The following example shows a sample PostgreSQL table schema and the logs collected by Logtail.
-
Sample table schema
// Create a table. CREATE TABLE IF NOT EXISTS specialalarmtest ( id BIGSERIAL NOT NULL, time TIMESTAMP NOT NULL, alarmtype varchar(64) NOT NULL, ip varchar(16) NOT NULL, COUNT INT NOT NULL, PRIMARY KEY (id) ); // Insert data. insert into specialalarmtest (time, alarmtype, ip, count) values(now(), 'NO_ALARM', '10.10.***.***', 0); insert into specialalarmtest (time, alarmtype, ip, count) values(now(), 'NO_ALARM', '10.10.***.***', 1); insert into specialalarmtest (time, alarmtype, ip, count) values(now(), 'NO_ALARM', '10.10.***.***', 2); insert into specialalarmtest (time, alarmtype, ip, count) values(now(), 'NO_ALARM', '10.10.***.***', 3); -
Sample logs: After you insert data, a log query returns three records with
idvalues of 14, 15, and 16;countvalues of 1, 2, and 3;alarmtypevalues ofNO_ALARM; and anipvalue of10.10.***.***.