NGINX supports a built-in status page that provides metrics to help you monitor NGINX status. You can collect metrics from NGINX servers to the Full-stack Observability application to visualize the metrics.
Prerequisites
A Full-stack Observability instance is created. For more information, see Create an instance.
The server on which Logtail is installed can connect to the NGINX server whose metrics you want to collect.
Step 1: Configure the NGINX status module
Run the following command to check whether the NGINX status module is supported. For more information, see Module ngx_http_stub_status_module.
nginx -V 2>&1 | grep -o with-http_stub_status_module
with-http_stub_status_module
If with-http_stub_status_module is returned, the NGINX status module is supported.
Configure the NGINX status module.
Enable the NGINX status module in the NGINX configuration file. The default NGINX configuration file is /etc/nginx/nginx.conf. The following sample code provides an example on how to enable the NGINX status module. For more information, see Enable Nginx Status Page.
     location /private/nginx_status {
       stub_status on;
       access_log   off;
       allow 192.0.2.1;
       deny all;
     }
/private/nginx_status specifies the Uniform Resource Identifier (URI) of the NGINX status module. Replace the value with the actual URI.
allow 192.0.2.1 specifies that only a server whose IP address is 192.0.2.1 can access the NGINX status module. Replace the value with the actual IP address.
Run the following command to check whether the server on which Logtail is installed can access the NGINX status module:
$curl http://192.0.2.1/private/nginx_statusIf the following information is returned, the NGINX status module is enabled:
Active connections: 1
server accepts handled requests
2507455 2507455 2512972
Reading: 0 Writing: 1 Waiting: 0
Step 2: Create a Logtail configuration
Log on to the Simple Log Service console.
In the Log Application section, click the Intelligent O&M tab. Then, click Full-stack Observability.
On the Simple Log Service Full-stack Observability page, click the instance that you want to manage.
In the left-side navigation pane, click Full-stack Monitoring.
If this is your first time to use Full-stack Monitoring in the instance, click Enable.
In the left-side navigation tree, click Data Collection. On the Data Import Configurations page, turn on NGINX in the Middleware Monitoring section.
The first time you create a Logtail configuration for host monitoring data, turn on the switch to go to the configuration page. If you created a Logtail configuration, click the
 icon to go to the configuration page.
 In the Machine Group Configurations step, configure a machine group.
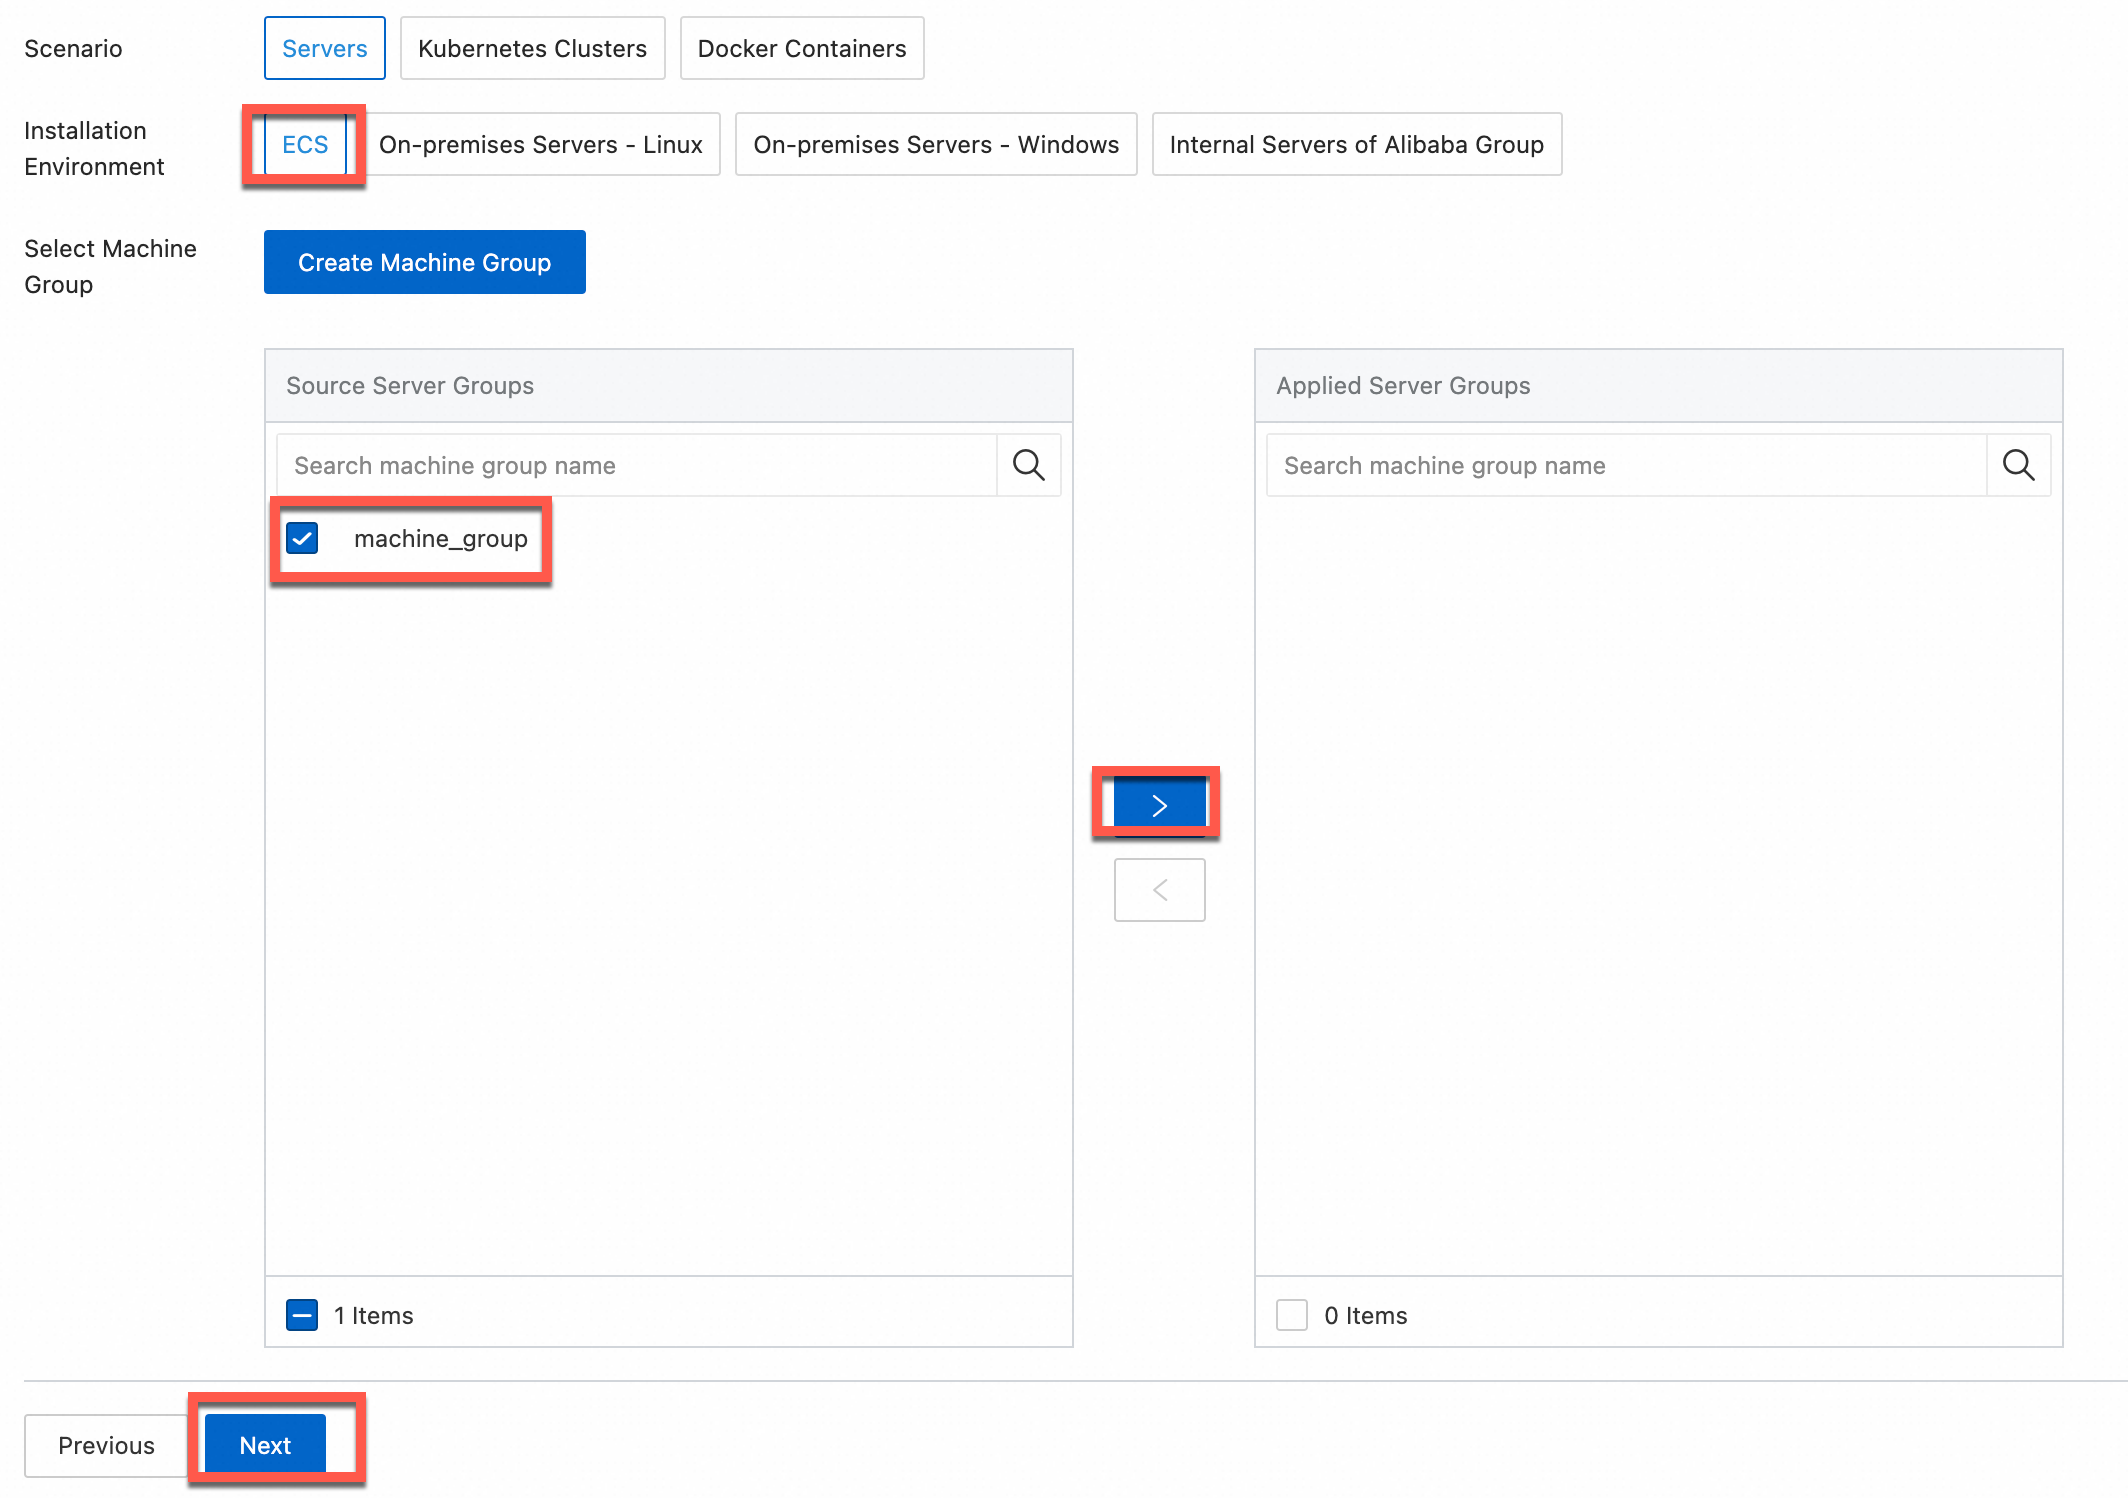
Configure the Scenario and Installation Environment parameters based on your business requirements.
ImportantYou must configure the Scenario and Installation Environment parameters regardless of whether a machine group is available. The parameter settings affect subsequent configurations.
Make sure that a machine group is displayed in the Applied Server Groups section and click Next.
Machine group available
Select a machine group from the Source Machine Group section.
No machine group available
Click Create Machine Group. In the Create Machine Group panel, configure the parameters. You can set the Machine Group Identifier parameter to IP Address or Custom Identifier. For more information, see Create a custom identifier-based machine group or Create an IP address-based machine group.
ImportantIf you apply a machine group immediately after you create the machine group, the heartbeat status of the machine group may be FAIL. This issue occurs because the machine group is not connected to Simple Log Service. To resolve this issue, you can click Retry. If the issue persists, see What do I do if no heartbeat connections are detected on Logtail?
In the Configure Data Source step, configure the following parameters and click Complete.
Parameter
Description
Configuration Name
The name of the Logtail configuration. You can enter a custom name.
Cluster Name
The name of the NGINX cluster. You can enter a custom name.
After you configure this parameter, Simple Log Service adds a
cluster=Cluster nametag to the NGINX monitoring data that is collected by using the Logtail configuration.ImportantMake sure that the cluster name is unique. Otherwise, data conflicts may occur.
Servers
The information about the NGINX server. The information includes the following configuration items:
Address: the address of the NGINX server. You can enter the IP address, hostname, or domain name of the server.
Port: the port number of the NGINX server.
Path: the URI of the NGINX status module. Example: /private/nginx_status. For more information about how to configure the NGINX status module, see Configure the NGINX status module.
You can add information about multiple NGINX servers based on your business requirements.
Custom Tag
The custom tags that you want to add to the collected NGINX monitoring data. The tags are key-value pairs.
After you configure this parameter, Simple Log Service adds the custom tags to the NGINX monitoring data that is collected by using the Logtail configuration.
Custom Telegraf Configurations
Simple Log Service collects NGINX monitoring data by using Telegraf. Telegraf is an open source tool that is used to collect metrics. If the preceding default parameters do not meet your business requirements, you can use Custom Telegraf Configurations to configure custom parameters. For more information about Telegraf, see Telegraf. For more information about configuration examples, see Configuration.
For more information about the metrics that can be collected, see Metrics.
After you complete the settings, Simple Log Service automatically creates assets such as Metricstores. For more information, see Assets.
What to do next
After NGINX monitoring data is collected to the Full-stack Observability application, the application automatically creates dedicated dashboards for the monitoring data. You can use the dashboards to analyze the monitoring data. For more information, see View dashboards.