CloudLens for SLS helps you monitor and manage SLS assets such as projects and Logstores, improving management efficiency and resource consumption visibility.
Features
CloudLens for SLS provides the following capabilities.
-
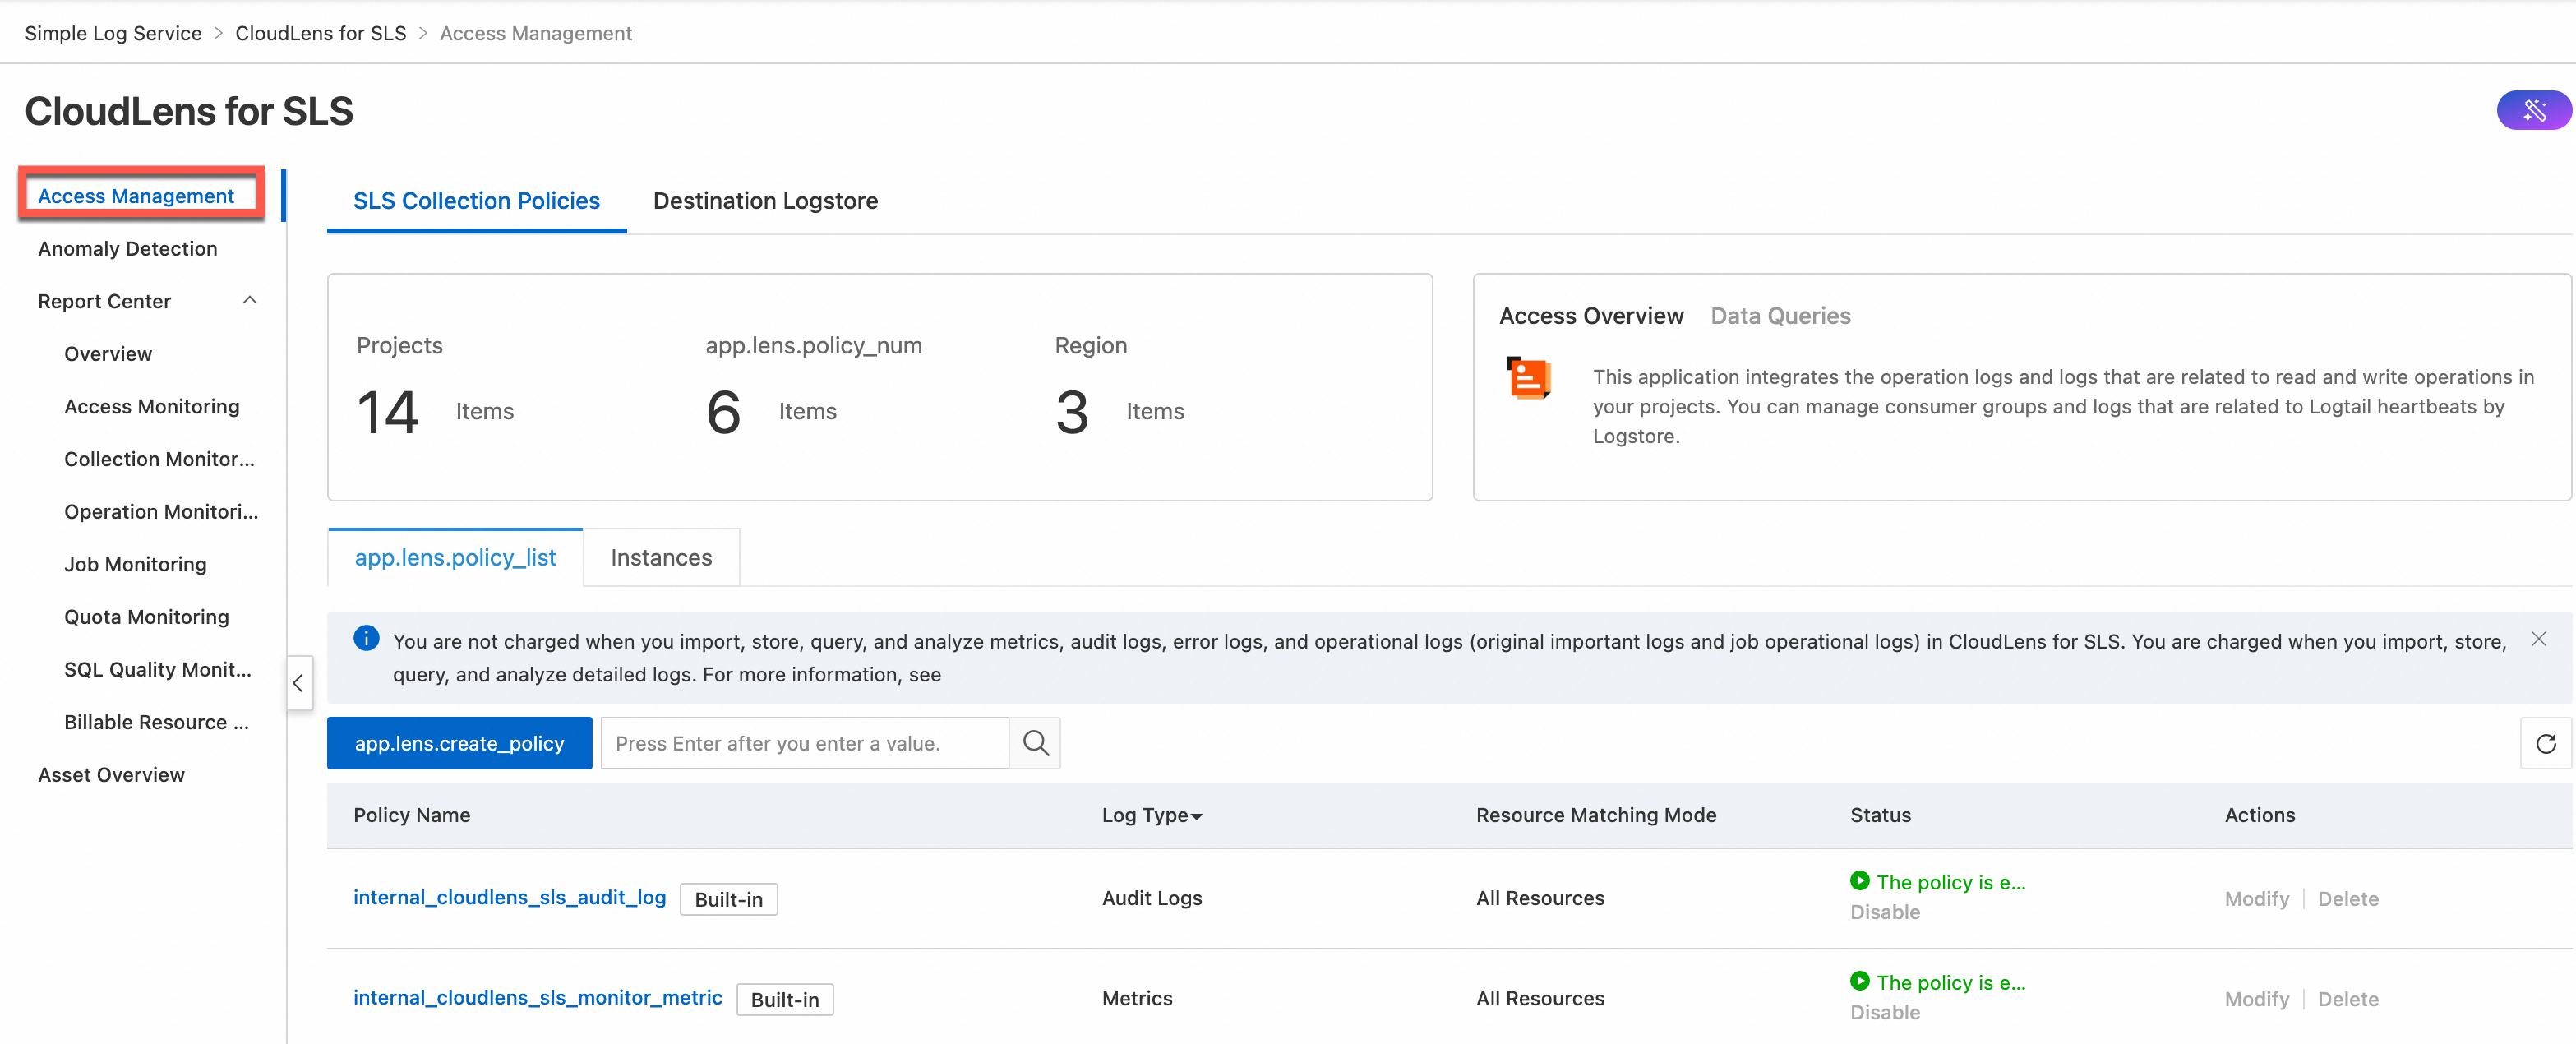
Centrally manage projects and Logstores in your account that meet specific conditions. For more information about the conditions, see Limits.
-
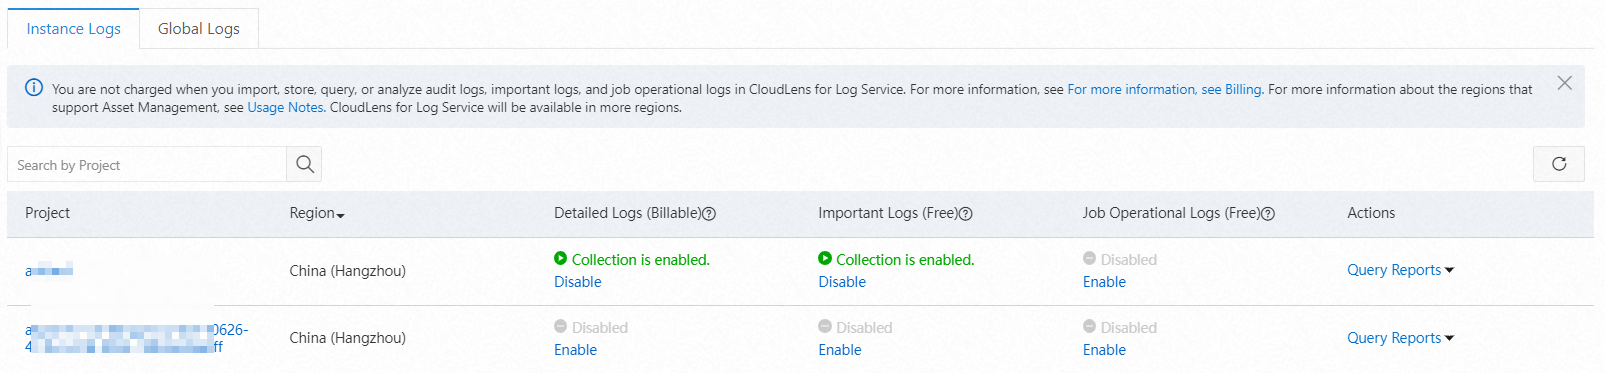
Enable one-click collection for instance logs (important logs, detailed logs, and job operational logs) and global logs (audit logs, billing logs, error logs, and monitoring metrics), and centrally manage collection status.
NoteInstance logs (important, detailed, and job operational) and global logs (audit, error, and monitoring metrics) are viewable only after you enable log collection.
-
Important logs: Consumer group consumption delay logs at the Logstore level, plus Logtail error, heartbeat, and statistics logs. Stored in the internal-diagnostic_log Logstore of a specified project.
-
Detailed logs: Operation logs for creating, modifying, updating, and deleting assets within a project, plus data read/write logs. Stored in the internal-operation_log Logstore of a specified project.
-
Job operational logs: Error and latency data for data import (new version), scheduled SQL, and data shipping (new version) tasks. Stored in the internal-diagnostic_log Logstore of a specified project.
-
Audit logs: Operation logs for creating, modifying, updating, and deleting resources across all projects in your account. Stored in the internal-audit_log Logstore of a specified project.
-
Billing logs: SLS billing data collected through Cost Manager, stored in Tablestore (OTS) and updated daily. Description of billing data.
Note-
Initial data import takes 1-2 hours, depending on billing data volume.
-
Only public cloud users can enable billing logs.
-
Once enabled, this feature cannot be disabled.
-
-
Error logs: Errors from resource operations (create, modify, update, delete) and data read/write across all projects in your account. Stored in the internal-error_log Logstore of a specified project.
-
Monitoring metrics: Traffic, request, and latency metrics at the project and Logstore levels. Stored in the internal-monitor-metric MetricStore of a specified project.
-
-
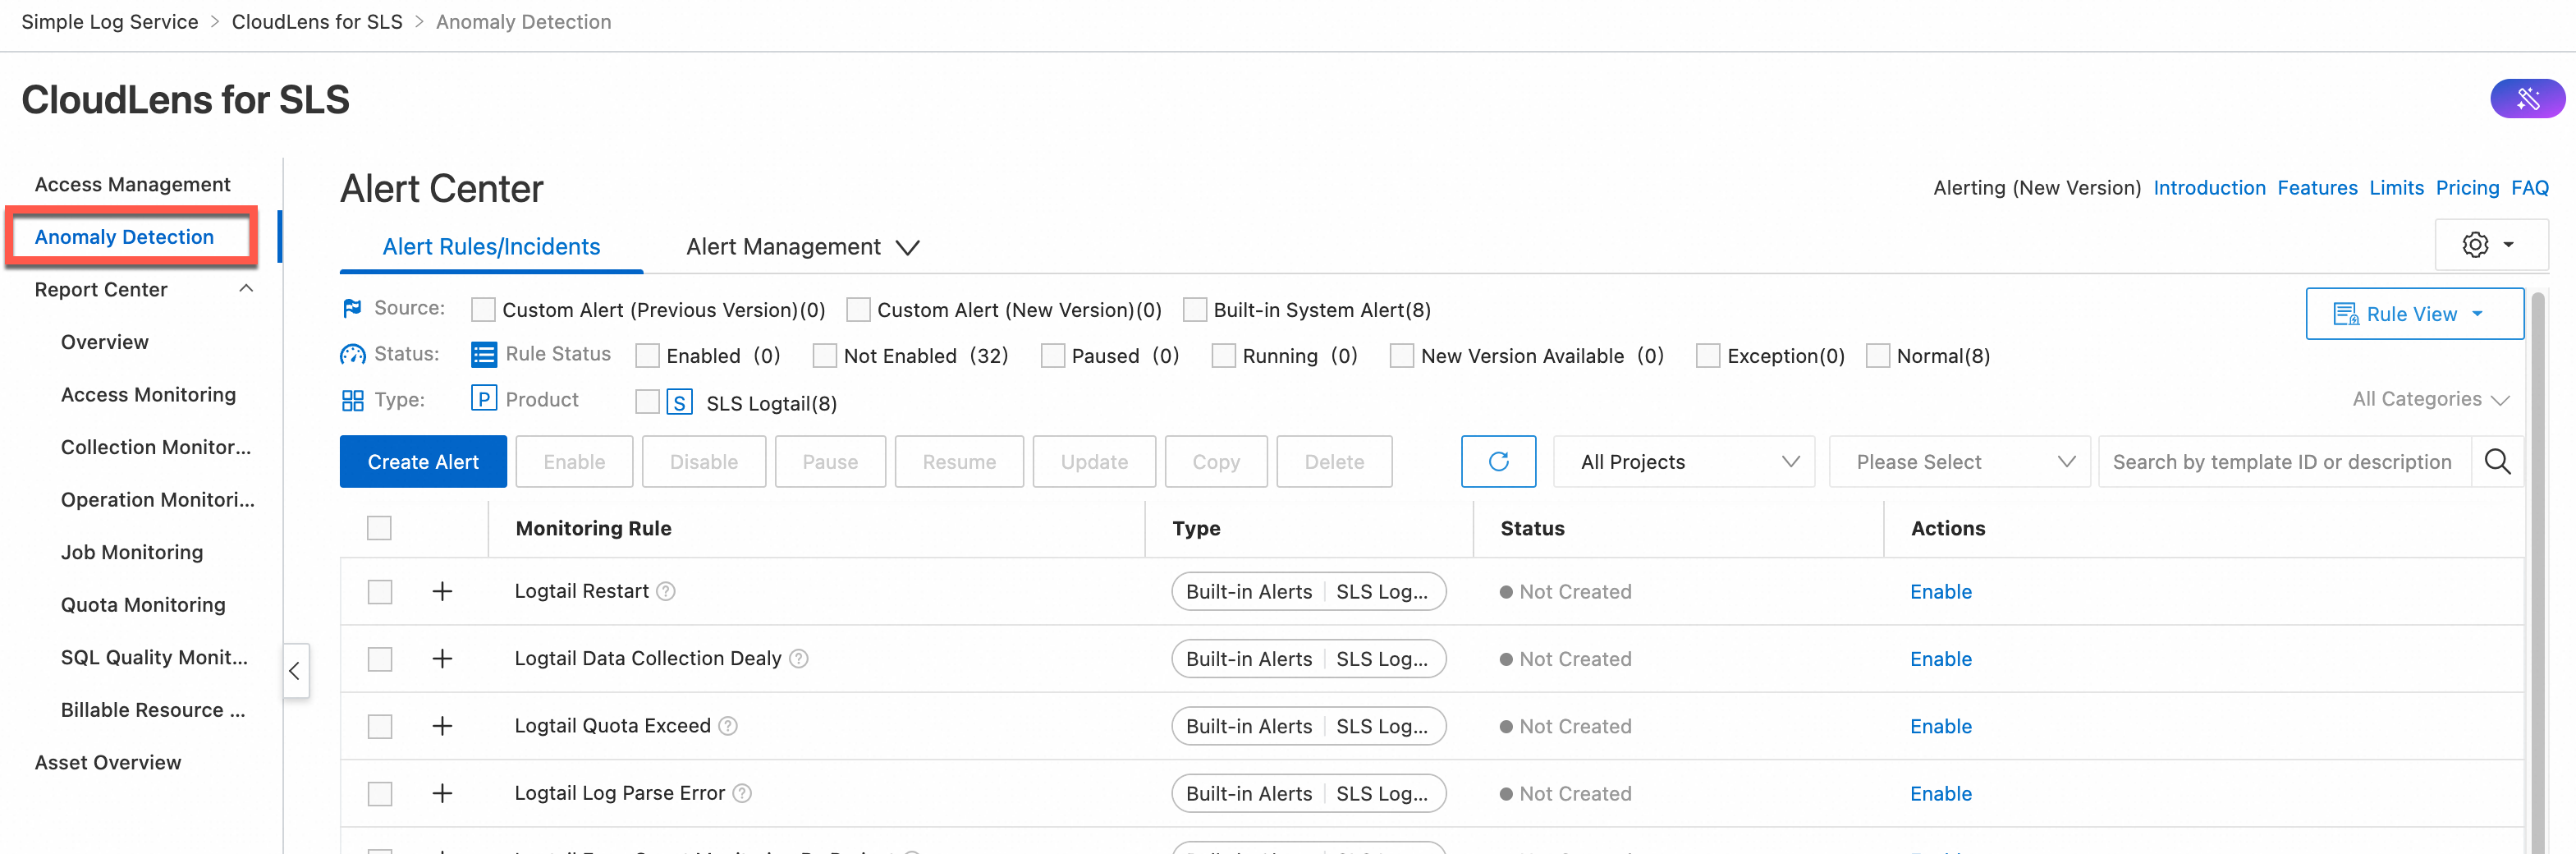
CloudLens for SLS provides preset alert rules (baseline alerts, period-over-period comparisons) for resources such as projects, Logtail, and consumer groups. Notifications support text messages, DingTalk, email, voice calls, and custom webhooks. Set alerts.
-
Visual reports span eight categories: Overview, Access Monitoring, Collection Monitoring, Operation Monitoring, Job Monitoring, Quota Monitoring, SQL Quality Monitoring, and Billable Resource Monitoring. View data reports.
-
View quota information for eligible projects and Logstores in your account. For more information about the conditions, see Limits.
Scenarios
-
Development and operations
Monitor and manage SLS assets such as projects and Logstores. Query and analyze detailed logs, important logs, and job monitoring logs to troubleshoot issues faster.
-
IT O&M
Detect and respond to anomalies in project service status, traffic, quotas, and Logtail metrics through built-in alerting.
-
Security audit
Audit logs record resource operations (create, update, delete) within projects, enabling security analysis over specific time frames.
Asset details
-
Project, Logstore, and MetricStore
-
When you enable important log and job operational log collection, SLS creates an internal-diagnostic_log Logstore in your selected project.
-
When you enable detailed log collection, SLS creates an internal-operation_log Logstore in your selected project.
-
When you enable audit log collection, SLS creates an internal-audit_log Logstore in your selected project.
-
When you enable error log collection, SLS creates an internal-error_log Logstore in your selected project.
-
When you enable monitoring metric collection, SLS creates an internal-monitor-metric MetricStore in your selected project.
-
-
Dashboard
Dashboard
Description
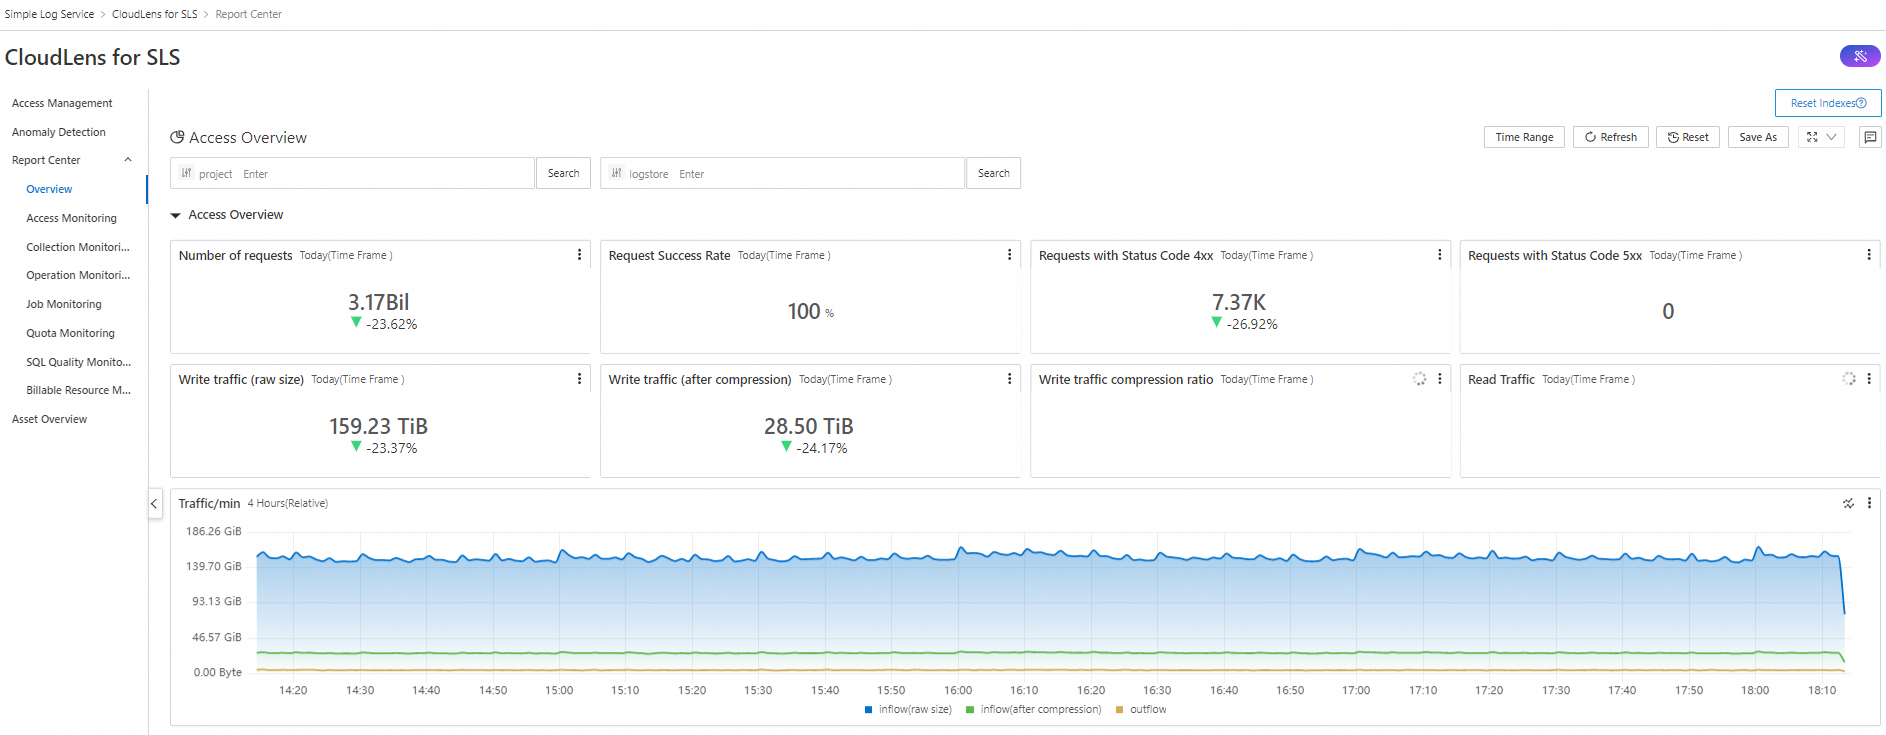
Overview
Overview
SLS project overview: read/write requests, request success rate, 4xx/5xx requests, write traffic (raw/compressed), compression ratio, and read traffic.
Access Monitoring
Access Traffic Monitoring
Total daily requests, client/user count, top 10 source IPs by read/write traffic, request count, write traffic, shard write/consumption traffic trends, per-minute read/write traffic changes, and access source distribution.
Access Exception Monitoring
Daily requests, failed request ratio, throttling errors, error status distribution, Logstores exceeding write limits, abnormal request count, and processing time trends.
Consumer Group Monitoring
Consumer group count, consumed Logstores/shards, latency count, data ratio, consumer group list, top 10 by latency, and consumption lag.
Collection Monitoring
Logtail Overall Status
Active Logtail instances, raw data traffic, running status/memory distribution, overall status, CPU/memory trends, and data sending traffic.
Logtail File Collection Monitoring
Collected files, collection machines, file distribution, log volume, average latency, parsing failure rate, and sending trends.
Logtail Exception Monitoring
Active Logtail instances, restart list, restarted client count, and error messages.
Operation Monitoring
Operation Monitoring
Total Logstore operations, operation failure rate, and operation client count.
Job Monitoring
Data Processing Monitoring
Data import (new version), data shipping (new version), and scheduled SQL task status: successful/failed reads and writes, Internet traffic, processing speed, progress lag, and exceptions.
Quota Monitoring
Quota Monitoring
80% watermark warnings, quota overrun distribution, Logstore/machine group/Logtail config/project write traffic watermark ratios, and project resource quota details.
SQL Quality Monitoring
SQL Quality Monitoring
SQL health score, service metrics, running details, and SQL patterns.
Billable Resource Monitoring
Billable Resource Monitoring
Hot storage, index traffic, read/write traffic, usage trends, and top project/Logstore details.
Billing
CloudLens for SLS is free. Log billing details:
-
Ingestion, storage, query, and analysis of important logs, job operational logs, and audit logs are free. Data transformation and shipping are billed pay-as-you-go.
-
Detailed logs follow standard Logstore billing.
-
Billing logs incur no additional fees. Associated projects and Tablestore instances are free.
Limits
CloudLens for SLS supports assets in the following regions only.
|
Cloud type |
Region |
|
Public cloud |
China (Hangzhou), China (Qingdao), China (Beijing), China (Zhangjiakou), China (Hohhot), China (Ulanqab), China (Shanghai), China (Chengdu), China (Shenzhen), China (Heyuan), China (Guangzhou), China (Hong Kong), Indonesia (Jakarta), Malaysia (Kuala Lumpur), Philippines (Manila), Singapore, South Korea (Seoul), Thailand (Bangkok), Japan (Tokyo), UK (London), Germany (Frankfurt), UAE (Dubai), US (Silicon Valley), US (Virginia) |
Notes
The CloudLens feature requires at least one project to exist under your Alibaba Cloud account.
When you enable and use the CloudLens feature, Simple Log Service checks whether a project exists under your account based on the following logic.
Detection logic
When you enable the CloudLens feature for the first time, Simple Log Service checks whether a project exists under your Alibaba Cloud account. If no project exists, a project named
aliyun-product-data-Alibaba Cloud account ID-cn-heyuanis created in the China (Heyuan) region.After you enable the CloudLens feature and navigate to the CloudLens page, Simple Log Service checks only whether a project exists under your Alibaba Cloud account. It does not automatically create a project in the China (Heyuan) region. You can manually create a project. For more information about how to create a project, see Manage projects.
Delete a project
To delete the
aliyun-product-data-Alibaba Cloud account ID-cn-heyuanproject, open Cloud Shell and run the following command. Replace Alibaba Cloud account ID with your actual account ID.aliyunlog log delete_project --project_name=aliyun-product-data-Alibaba Cloud account ID-cn-heyuan --region-endpoint=cn-heyuan.log.aliyuncs.comFor more information about how to delete other projects and Logstores, see Manage Logstores and Manage projects.