Table value mapping converts column data types and displays the results in a dashboard.
Prerequisites
-
You have collected log data. For more information, see Collect text logs from a host.
-
You have created indexes. For more information, see Create an index.
Overview
In the Value Mapping configuration of a dashboard chart, configure three mapping rules to replace empty values: map Empty String to 0, map NaN to 0, and map Null or undefined to 0. Example query and analysis statement: * | select split_part(request_uri,'?',1) as path, count(1) as pv, '' as empty, 'NaN' as nan group by split_part(request_uri,'?',1) order by pv desc limit 10.
-
Query and analysis: You can query and analyze logs in the console. For example, you can retrieve logs, aggregate log data, and generate statistics.
-
Add a chart: Each dashboard consists of one or more charts. Each chart is based on one or more query and analysis statements.
-
Add a value mapping: Convert string values in a table to numbers.
Step 1: Query and analysis
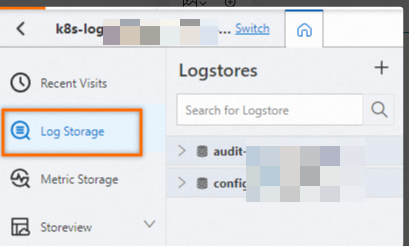
Log on to the Simple Log Service console. In the Projects section, click the project you want.

On the tab, click the logstore you want.
-
Enter a query and analysis statement, and then click Last 15 Minutes to set the time range.
For example, to query the paths and number of imported files, use the following statement:
* | select split_part(request_uri,'?',1) as path, count(1) as pv, '' as empty, 'NaN' as nan group by split_part(request_uri,'?',1) order by pv desc limit 10
Step 2: Add a chart
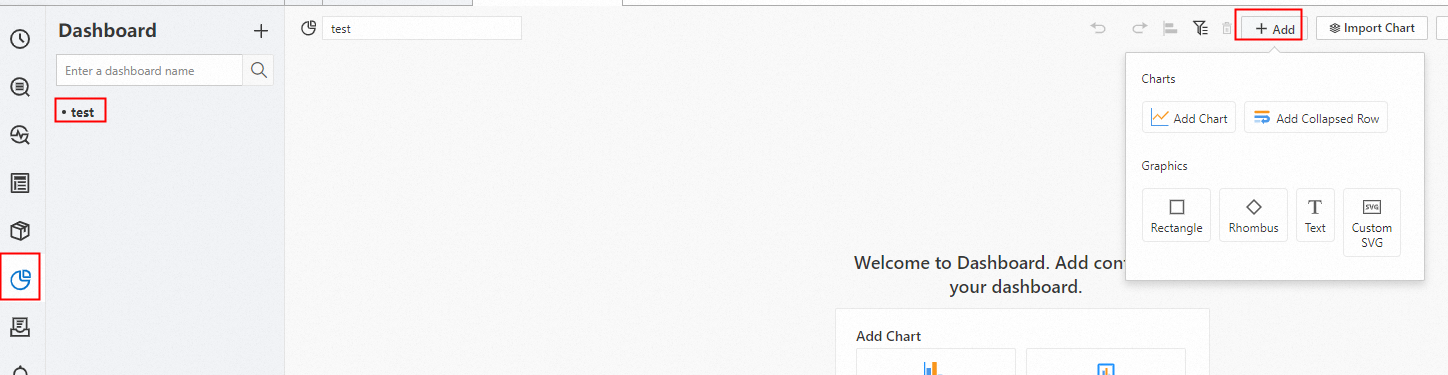
In the left-side navigation pane, choose . In the Dashboard list, click the dashboard you want. In the upper-right corner of the dashboard page, click Edit. In edit mode, choose .
-
In the section, select the
 icon for Chart Type. On the Query and Analysis tab, select your data source (in this case, LogStore (SQL)), select the target Logstore, and enter a query statement.
In the upper-right corner, select a time range such as Last 15 Minutes and click Apply.
Set Chart Type to Table. An example query:
* | select *.
Step 3: Add a value mapping
Empty value replacement
: Replace Empty String, NaN, or Null or undefined with 0.
Icon replacement
: Replace a specific number with an icon.
For example, after you map 500 and 452 to icons, the pv column displays the icons instead of the original numbers.
Text replacement
: Replace a specific number with text.
For example, if you map 500 to true and 452 to false, the pv column displays the mapped text.