Microsoft provides various tools to analyze memory usage and memory issues in Windows, such as the built-in Task Manager, Resource Monitor, and Performance Monitor, and SysInternals tools such as RAMMap and PoolMon. This topic describes how to use the preceding tools. For more information, see the corresponding Microsoft documentation.
The examples in this document use Windows Server 2012. The user interface may vary across OS versions, so refer to the interface on your own system.
Task Manager
Use Task Manager to monitor memory usage and view detailed information about memory-consuming processes. On the Performance tab, check the system's virtual memory usage by comparing the Committed Bytes value to the Commit Limit. If the Committed Bytes value is close to the Commit Limit, the system may experience performance issues.
-
Remotely connect to the Windows server.
-
On the Windows desktop, open .
-
Click the Performance tab and select Memory from the left pane to view memory usage.
In the memory details area, note the Committed value (for example, 2.1/9.9 GB), which shows the current committed memory relative to the system's total Commit Limit.
Resource Monitor
Use Resource Monitor to view memory usage, especially for individual processes.
-
Remotely connect to the Windows server.
-
In the search box on the taskbar, enter
Resource Monitorand open the application. -
Click the Memory tab to view the memory usage of each process. For each process, focus on the Commit (KB) value to identify processes that consume large amounts of memory and determine whether this usage is expected for your workload.
Physical memory usage consists of the following components:
-
Hardware Reserved: Memory reserved for hardware.
-
In Use: Memory used by processes, drivers, and the operating system.
-
Modified: Memory whose contents must be written to disk before it can be repurposed.
-
Standby: Memory that contains cached data and code that is not actively in use.
-
Free: Memory that contains no valuable data. This memory is used first when processes, drivers, or the OS need more memory.
-
Cache: When a file is opened, the system stores it in the cache to speed up future reads and writes. In Windows Server 2008 R2 and later, the system limits this cache's usage to ensure that sufficient physical memory remains available for applications, even if the cache is large.
-
Performance Monitor
Performance Monitor is an essential tool for monitoring and collecting system resource consumption data in Windows.
-
Remotely connect to the Windows server.
-
In the search box on the taskbar, enter
Performance Monitorand open the application. -
In the upper-left corner, choose .
By default, Performance Monitor samples various system resources once per second.
-
Add counters and view their performance data.
Add counters
-
To check system resource consumption in real time, click the
 icon to add the counters.
This icon is the green + (Add Counters) button on the Performance Monitor toolbar.
-
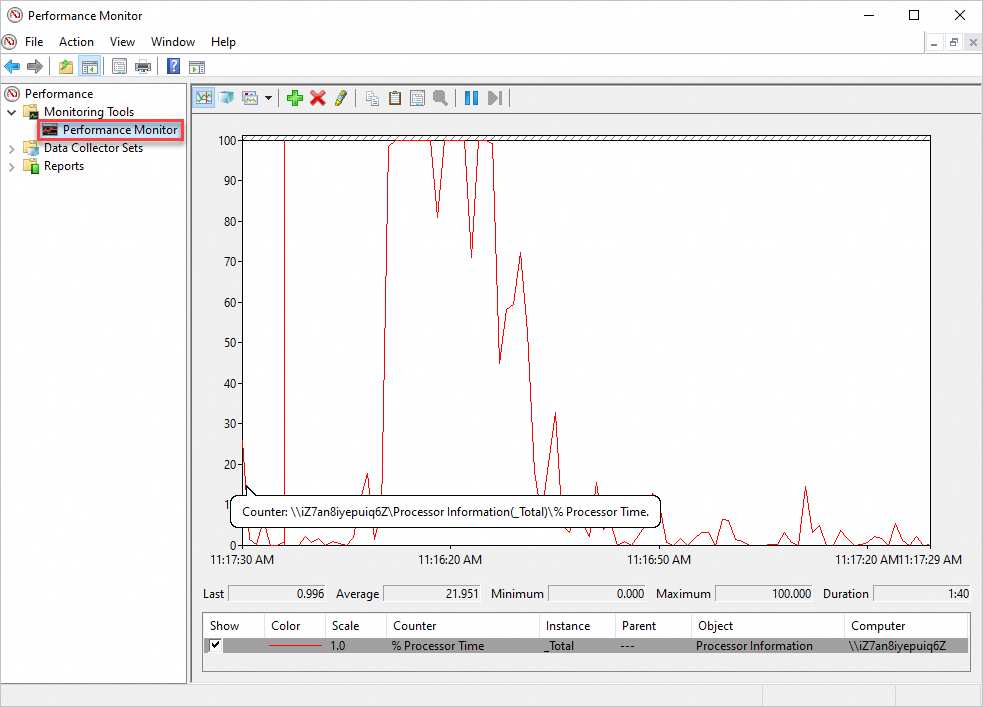
On the Performance Monitor page, view the performance data for the added counters.
User-defined set
-
In the navigation pane on the left, choose .
-
Hover over User Defined, right-click, select New, and then follow the on-screen instructions to add counters as needed.
For example, you can add counters for Logical Disk, Memory, System, Processor, and Process to view real-time resource status and define the collection frequency by setting the sampling interval. A 5-second interval is recommended for a memory leak that is slow to reproduce, while a 1-second interval is better for frequent high CPU usage.
Common performance counters to add include
\Processor(_Total)\% Processor Time,\Memory\Available KBytes,\Process(*)\% Processor Time,\Process(*)\IO Data Bytes/sec,\Process(*)\Private Bytes,\Process(*)\Thread Count, and\Process(*)\ID Process. For the log format, select Binary. -
On the Performance Monitor page, view the performance data for the added counters.
-
RAMMap, Process Explorer, and Poolmon
RAMMap
RAMMap is a Microsoft memory analysis tool. It is useful when physical memory is fully utilized but Task Manager shows no processes with high memory usage. This typically indicates that the kernel or a driver is consuming memory. Use RAMMap to view this memory usage, which is not displayed in Task Manager.
Process Explorer
Process Explorer is a Microsoft tool that provides a more detailed view of process resources than the built-in Windows Task Manager. Use Process Explorer to inspect detailed resource usage for each process, including various types of memory.
Memory-related columns include Virtual Size, Private, and Working Set.
Poolmon
Poolmon is a free Microsoft tool. The two core memory resources for the Windows kernel are the non-paged pool and the paged pool. Performance issues can occur if these memory resources are exhausted. While other tools can show overall resource consumption, you must use Poolmon to identify which specific pool tag is consuming the resources.
Check the perfmon logs to locate which pool tag is causing resource exhaustion. For example, if you find that the IoDn tag is causing the issue, use the following command to identify the driver file associated with that tag, which in this case is SafeDogFileGuard.sys. You can then resolve the issue, for example, by fixing or removing the corresponding driver or application.
findstr /m /l IoDn *.sysThe system displays output similar to the following:
C:\Windows\System32\drivers>findstr /m /l IoDn  *.sys
FINDSTR: Cannot open SafeDogFileGuard.sys