CloudFlow can be integrated with CloudMonitor. This topic describes how to view metrics and configure alerts of Serverless Workflow after CloudFlow is integrated with CloudMonitor.
View metrics
The CloudMonitor console provides two methods to allow you to view the metrics of a workflow. You can select an appropriate method based on your business requirements.
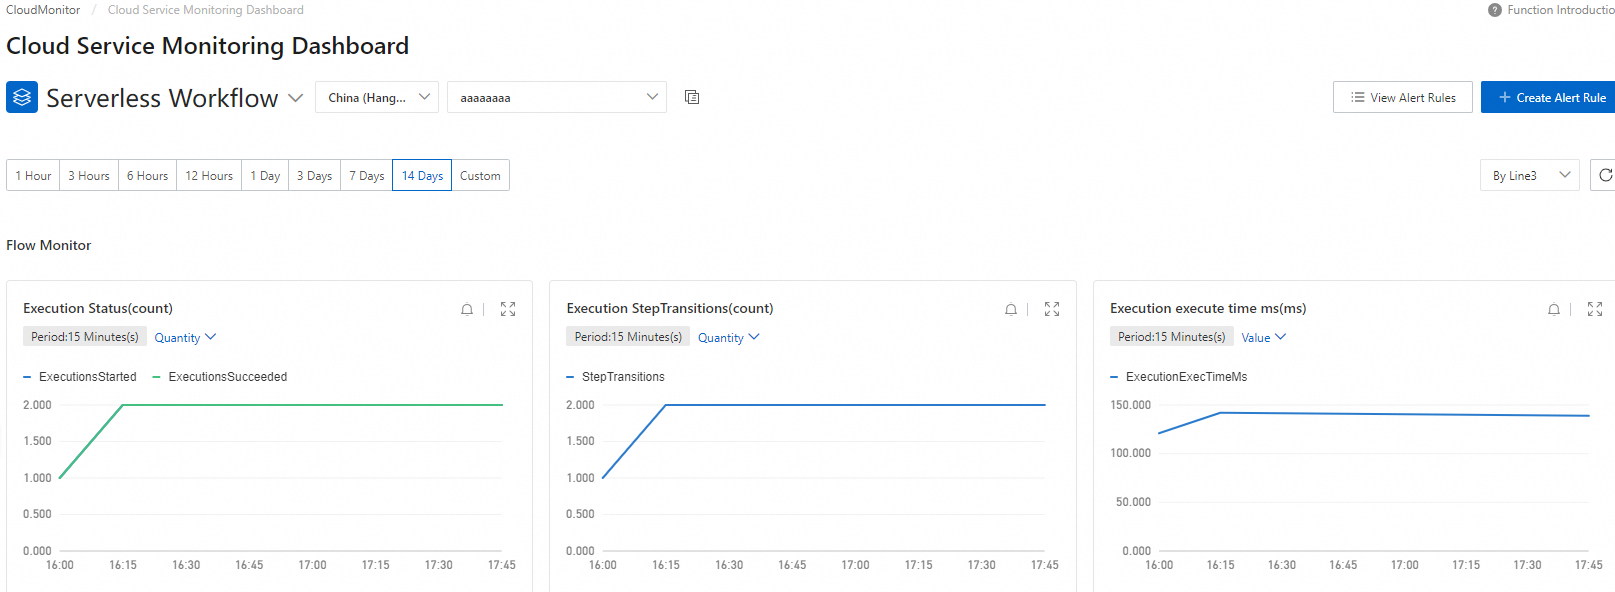
Method 1: Cloud Service Monitoring Dashboard
The Cloud Service Monitoring Dashboard page provides default metric charts.
Log on to the CloudMonitor console. In the left-side navigation pane, choose .
Select the type, region, and name of the resource that you want to view.
Method 2: Custom Dashboard
If you are familiar with the configuration procedure of CloudMonitor dashboards, you can directly select the metrics that you want to monitor and the names of the corresponding workflows to configure a CloudMonitor dashboard. The following procedure describes how to configure the settings when you are a first-time user of CloudMonitor.
Log on to the CloudMonitor console. In the left-side navigation pane, choose .
Click .
Enter a name for the Board Name parameter and select a folder from the Folder drop-down list. Click OK.

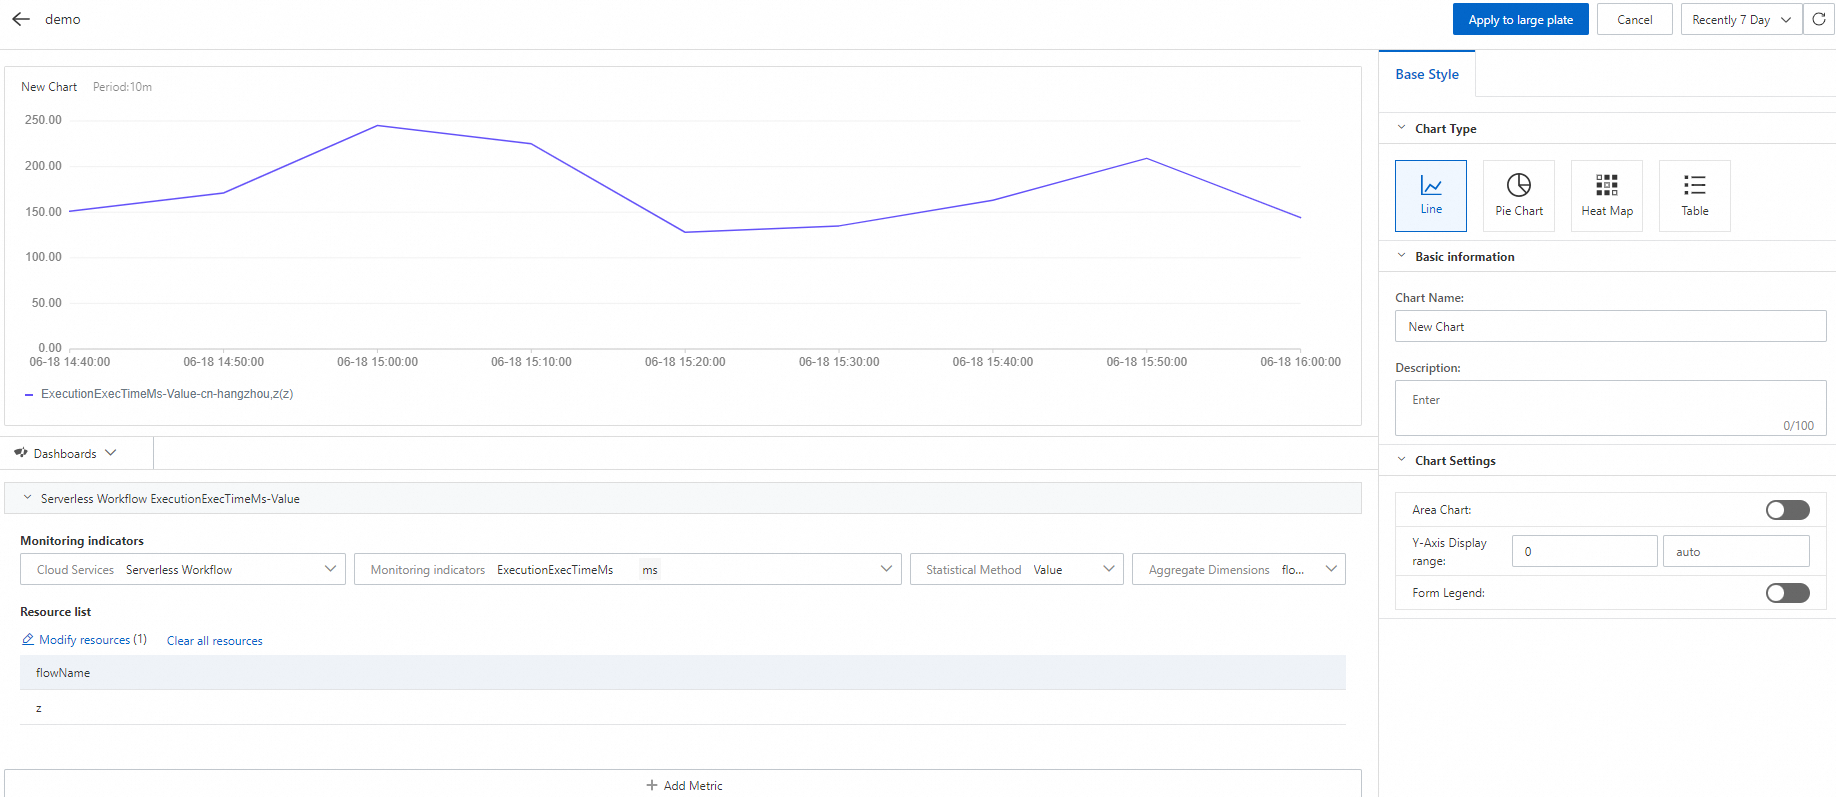
In the created dashboard, click Add Chart. On the page that appears, select a chart type, a cloud service, and a metric.
On the Dashboards tab, select a cloud service, specify a name for the chart, and then select a metric. Select the statistical method of the metric and the resources associated with the metric. You can add multiple metrics based on your business requirements. In this example, Serverless Workflow is selected for the Cloud Services parameter and a workflow is selected in the Resource list section.
For information about the metrics of Alibaba Cloud services, see Cloud service monitoring.
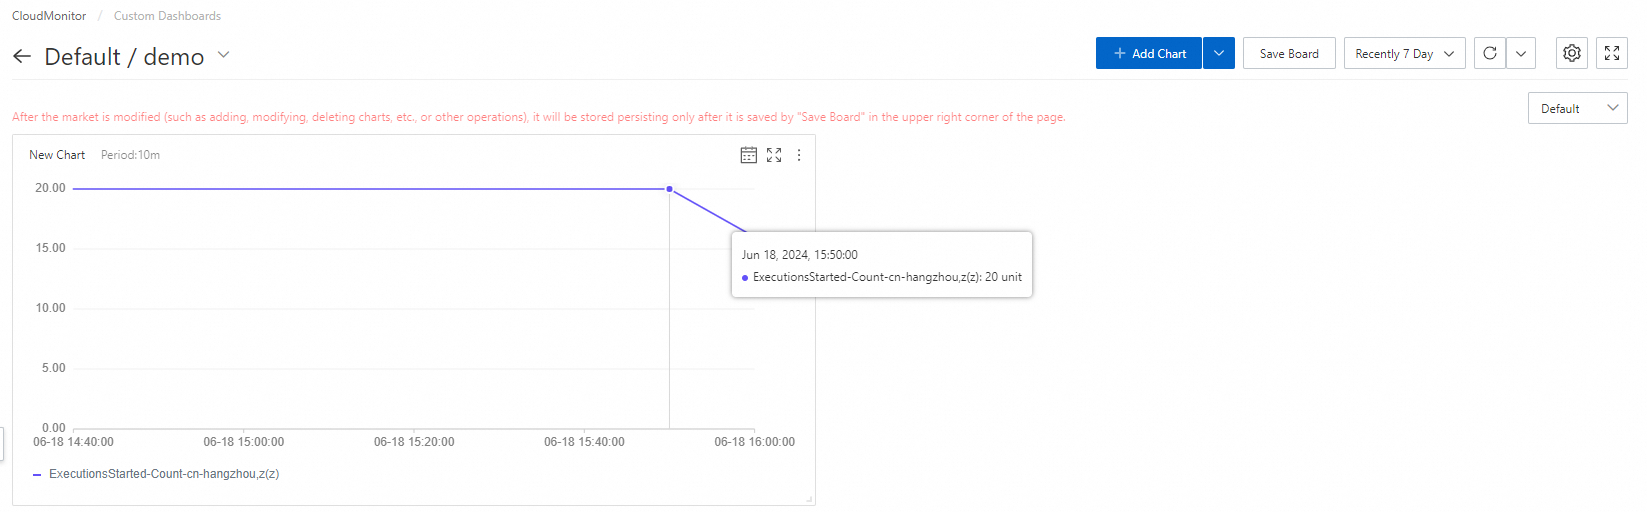
Click Apply to Dashboard. You can view the metric curve of the workflow on the Custom Dashboards page. Repeat the preceding steps to add multiple charts to display different metrics of other workflows.
Configure alerts
This section describes how to configure alerts for a workflow. For example, you can configure an alert to be triggered upon a specific number of workflow execution failures. Before you configure alerts, you must configure alert contacts. For more information about alert configurations, see Alert service.
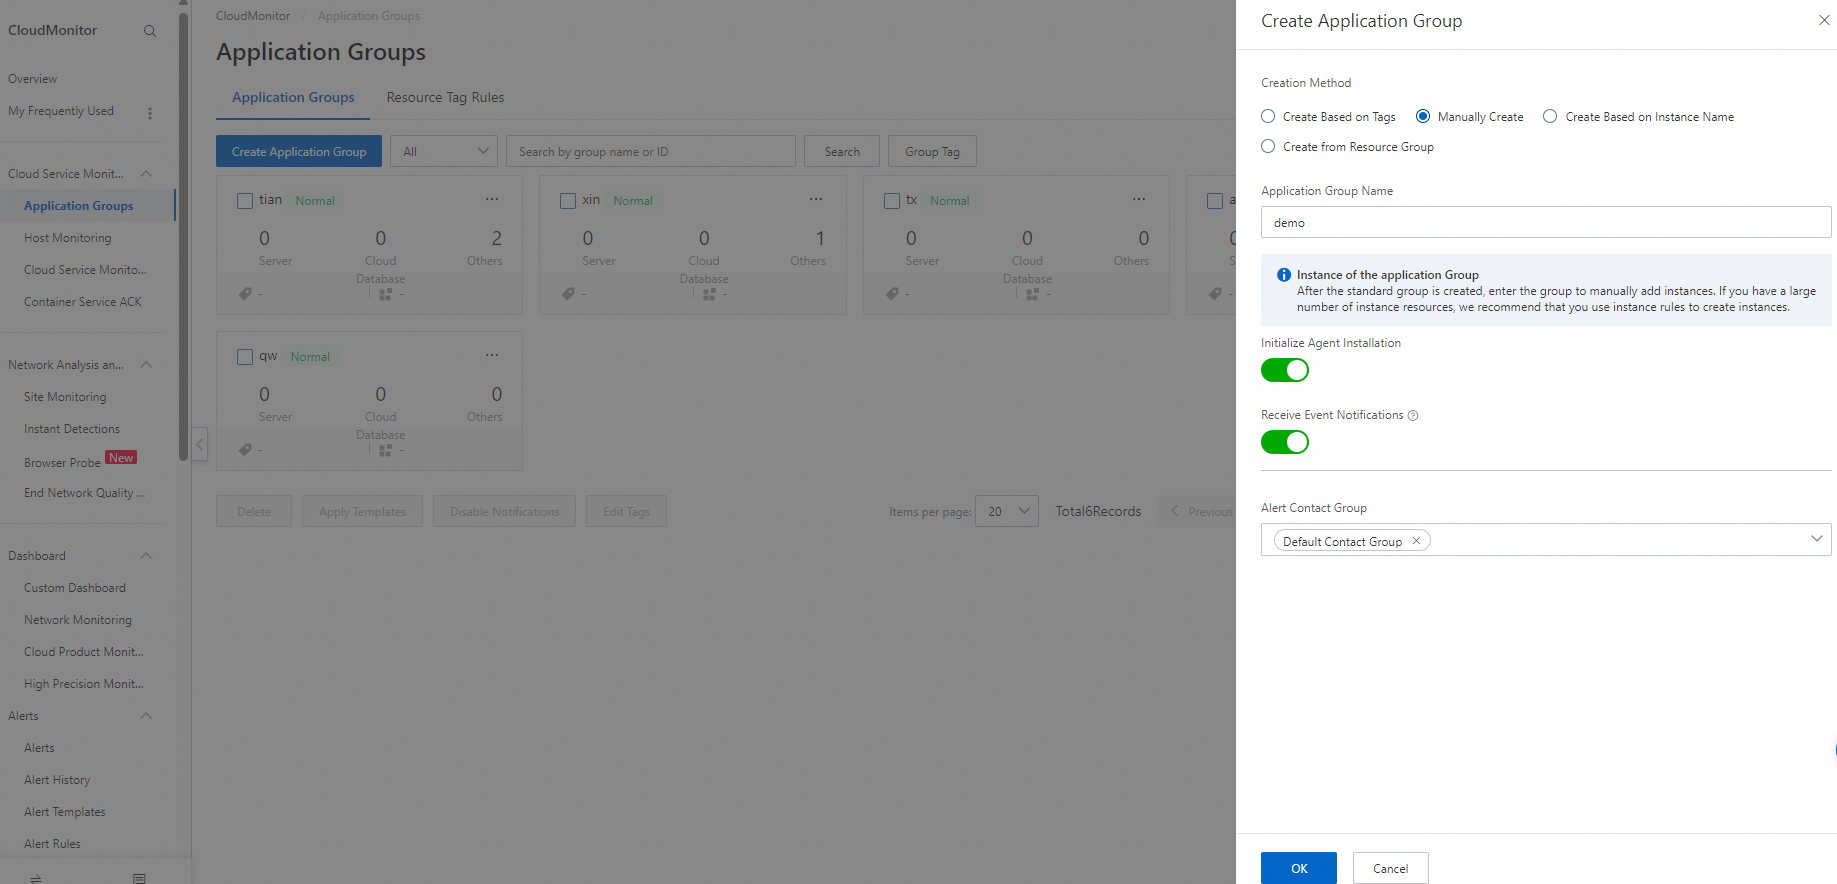
Log on to the CloudMonitor console. In the left-side navigation pane, choose .
On the Application Groups page, click Create Application Group. In the Create Application Group panel, configure the Application Group Name and Alert Contact Group parameters and click OK.
After the application group is created, you are redirected to the details page of the application group. Click Group Resources in the left-side navigation pane of the application group.
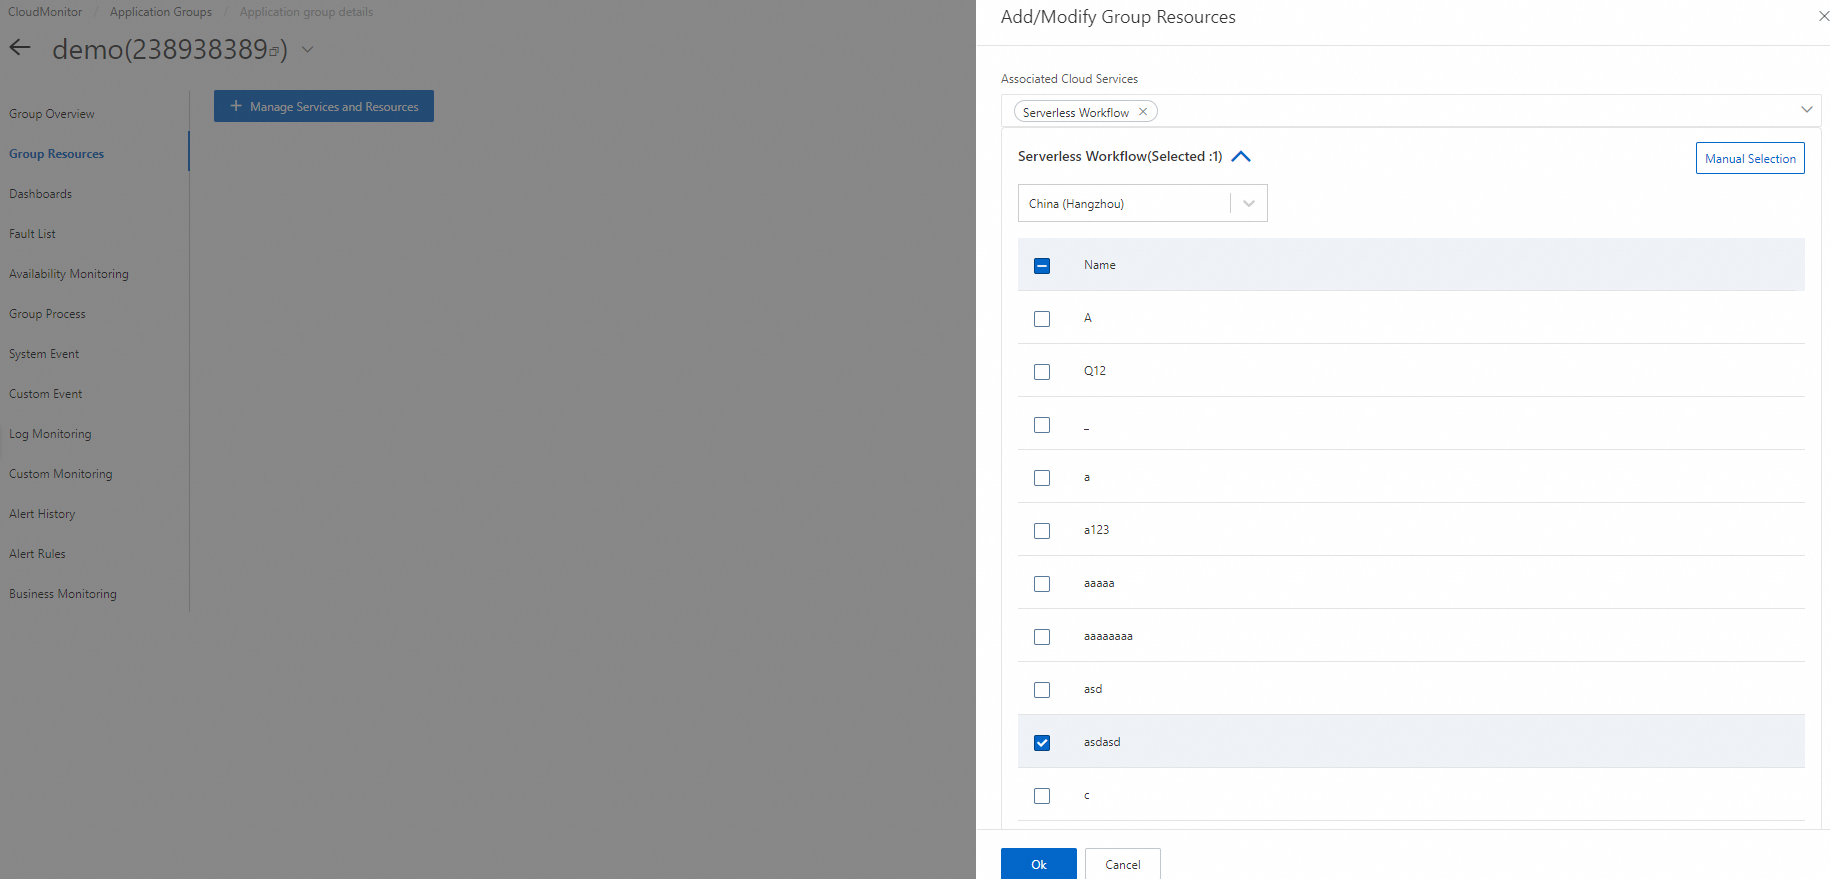
Click + Manage Services and Resources. In the Add/Modify Group Resources panel, enter or select Serverless Workflow in the Associated Cloud Services search box to associate CloudFlow with CloudMonitor. Select a region and the names of the workflows that you want to monitor and click OK.
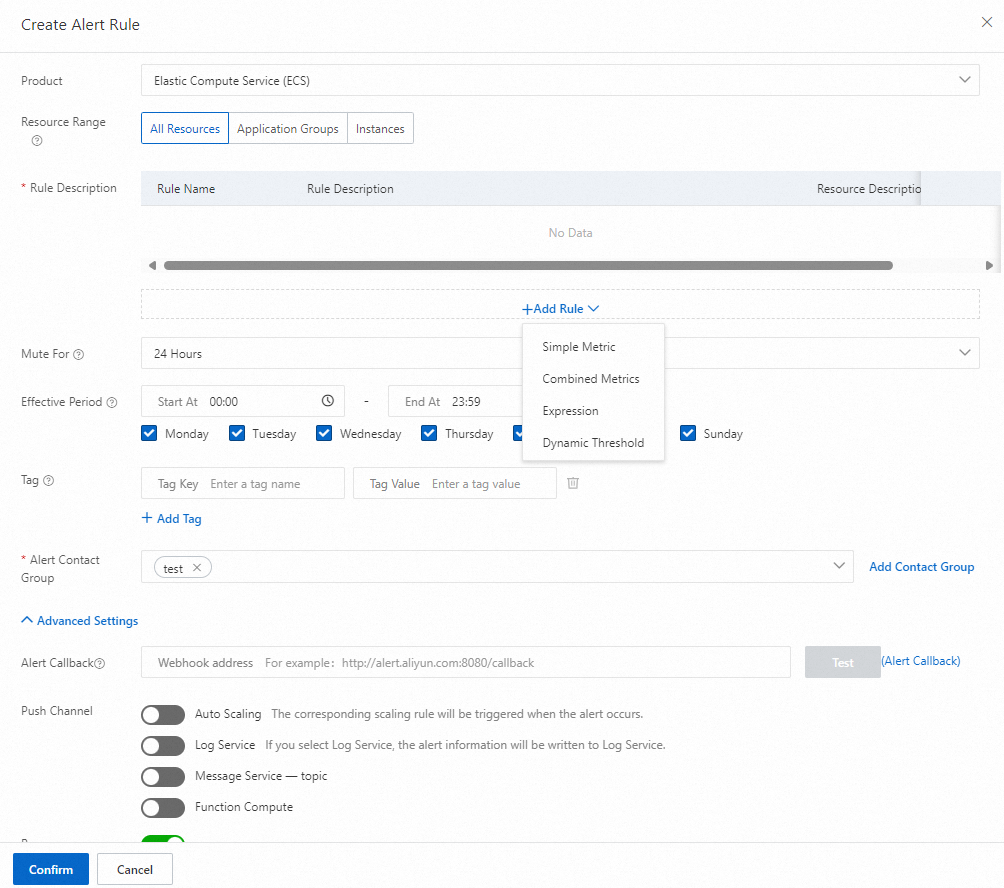
In the left-side navigation pane of the Application group details page, click Alert Rules. On the page that appears, click + Create Alert Rule. In the Create Alert Rule panel, configure the Mute For, Effective Period, and Alert Contact Group parameters, click + Add Rule, and then select a metric type from the Simple Metric, Combined Metrics, Expression, and Dynamic Threshold options.
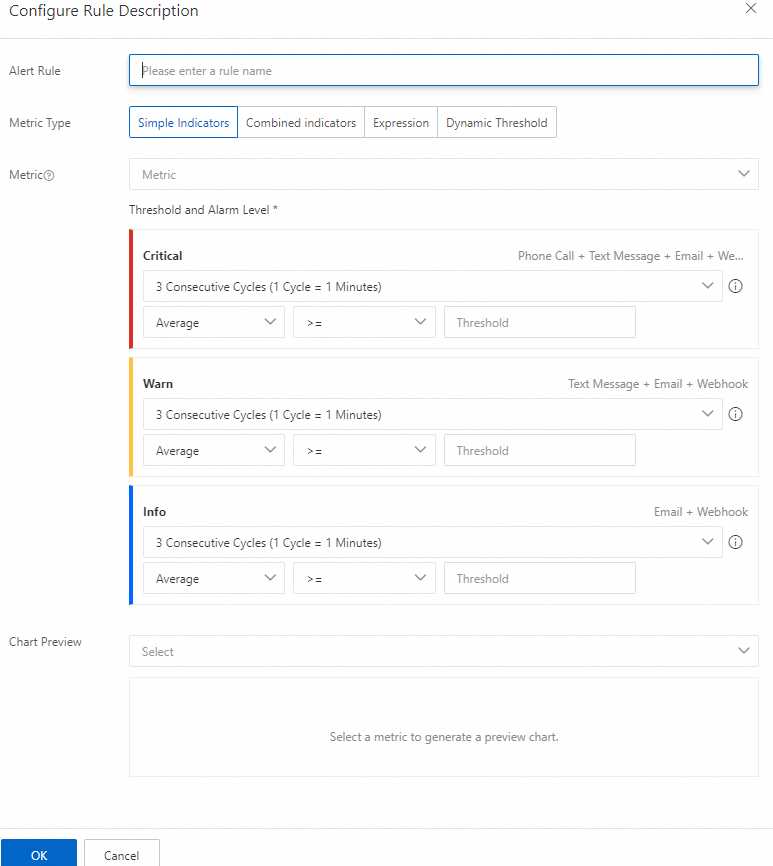
In the Configure Rule Description panel, configure the metrics that you want to monitor and the metric thresholds, and then click OK.
Check the configurations and click Confirm. When the configured alert is triggered, CloudMonitor sends an alert notification to the specified alert contacts.