Start, monitor, and debug workflow executions in the CloudFlow console. The Execution Details page provides graphical and tabular views of each state, step-level inputs and outputs, and event history for tracing failures.
Prerequisites
Before you begin, make sure that you have:
A workflow created in the CloudFlow console
Sufficient permissions to start and manage workflow executions
Execution details page overview
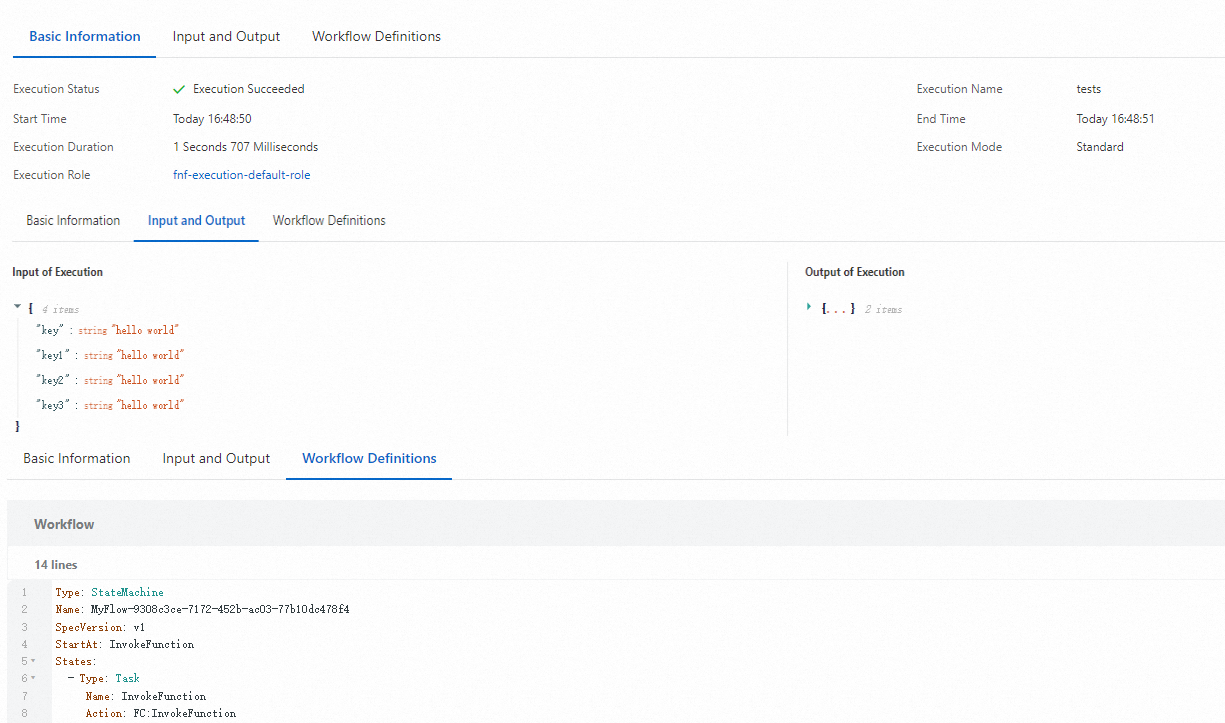
When you open an execution, the Execution Details page displays the following sections:
| Section | Description |
|---|---|
| Basic Information | Execution status and execution name |
| Input and Output | Input and output data for the execution |
| Workflow Definitions | State machine definition used by the execution |
| Graphical View / Table View | Two view modes for inspecting individual states |
| Execution events | Step-by-step record of the execution, including current step, input, output, duration, and failure cause |
Available actions:
Stop Execution -- Stop a running execution
Started Execution -- Start a new execution from the Workflows page
Start an execution
Log on to the CloudFlow console. Select a region in the top navigation bar.
On the Workflows page, click the target workflow.
On the Execution Records tab, click Started Execution.
In the Execute Workflow panel, configure the following parameters, and then click OK.
Parameter Required Description Execution Name No A name for this execution. Must be unique within the workflow. Input of Execution No Input data in JSON format. 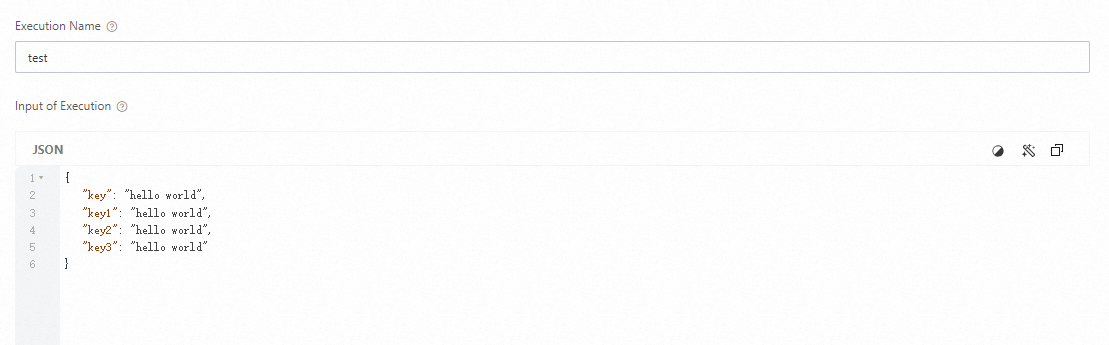
Stop an execution
On the Execution Records tab, click the execution name to open Execution Details. When the workflow is being executed, click Stop Execution to stop the execution.
View execution results
After an execution completes, click the execution name on the Execution Records tab to open Execution Details.
Graphical view
Select a state in the Graphical View tab to display its inputs, outputs, and execution events on the right. The selected state is also highlighted in the Table View tab.
Map state iterations
If the state machine contains Map states, use the Map field to switch between iterations. Iterations are zero-indexed: #0 is the first, #1 is the second, and so on.
For example, if a Map state runs five iterations and you want to inspect the third, select #2 from the Map field.
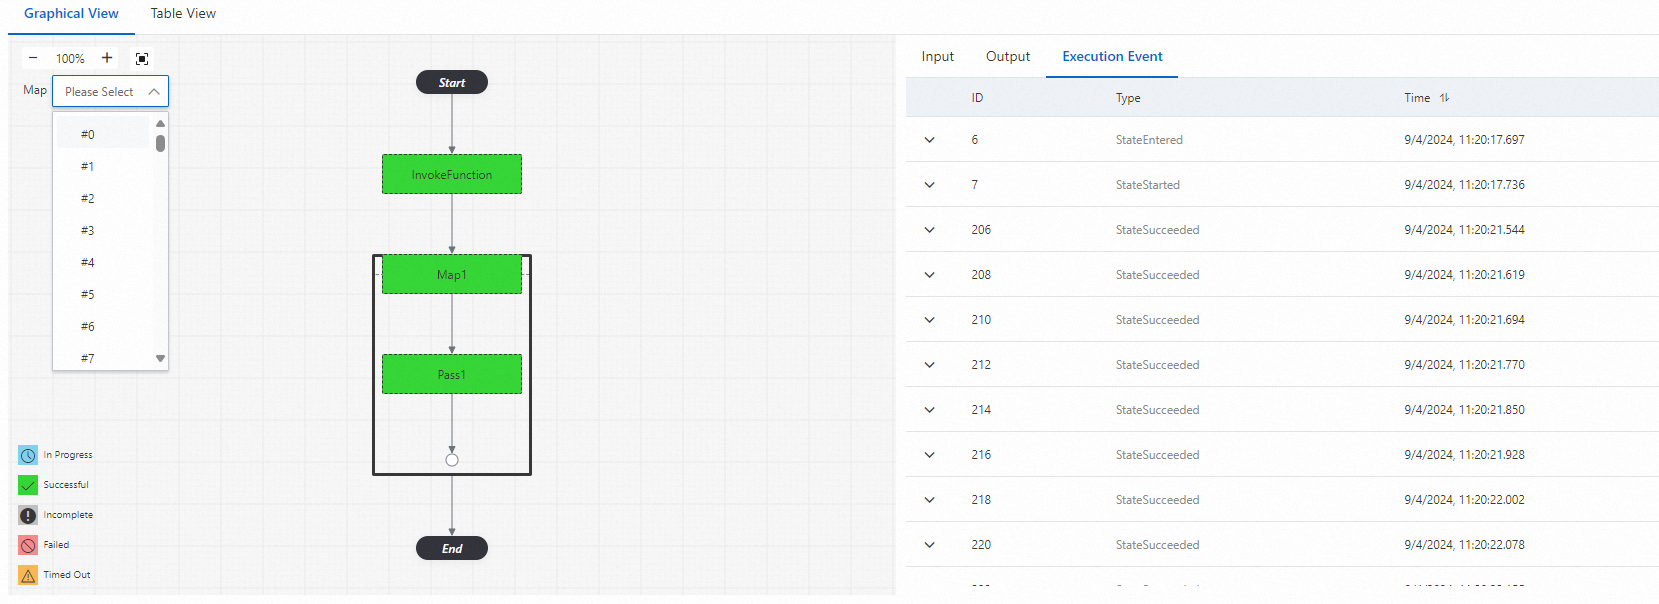
Table view
Select a state in the Table View tab to display its inputs, outputs, and execution events on the right. The selected state is also highlighted in the Graphical View tab.
To expand Map state or Parallel state details, click the  icon next to the state.
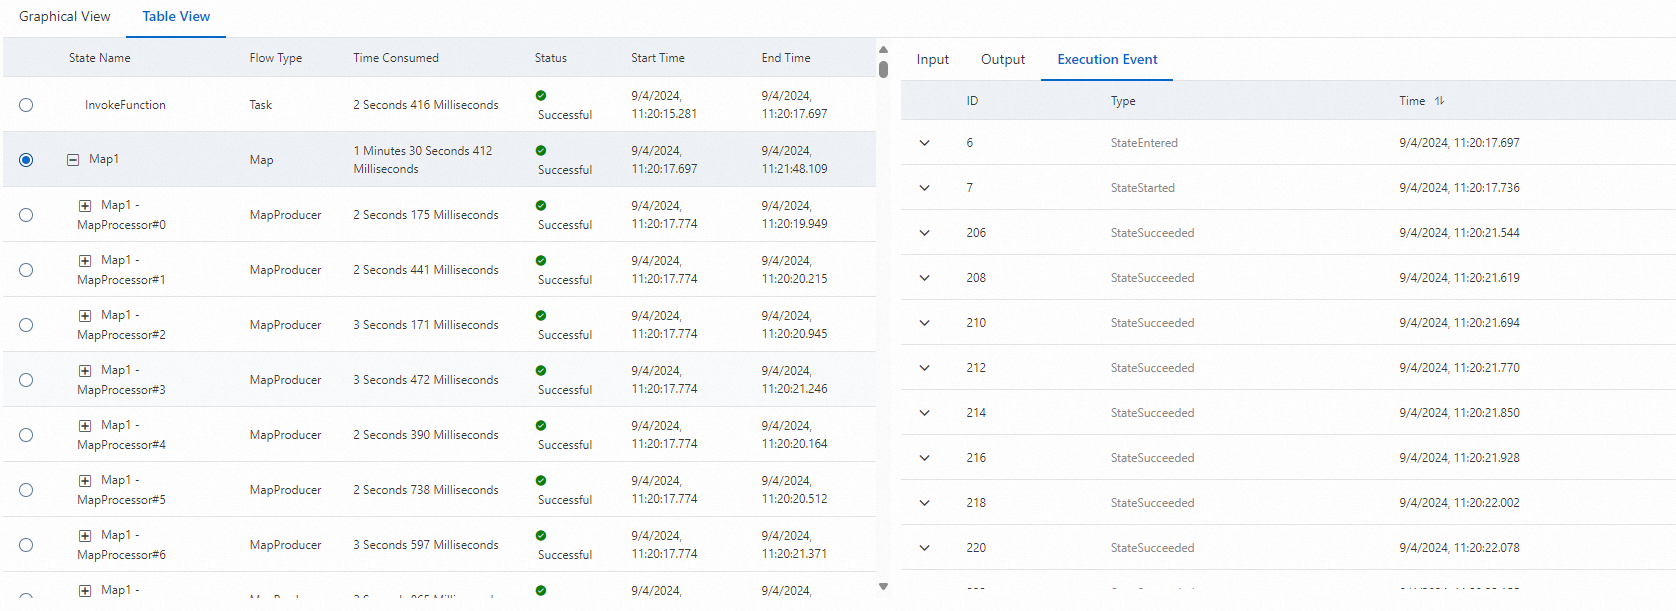
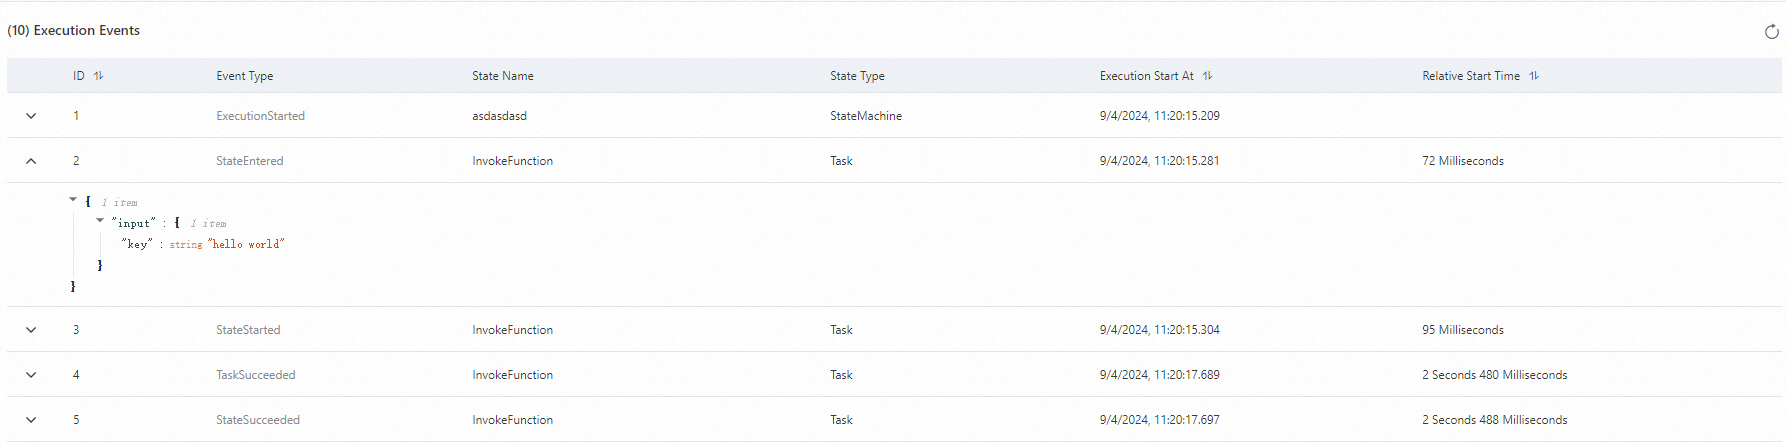
Execution events
Execution events record each step in a workflow run. Based on execution events, you can learn the information about a workflow, such as the current step, input, output, duration, and failure cause.
Each event records the following details:
| Field | Description |
|---|---|
| Step name | The state that was executed |
| Input | Data passed into the step |
| Output | Data returned by the step |
| Duration | Time the step took to complete |
| Failure cause | Error details if the step failed |
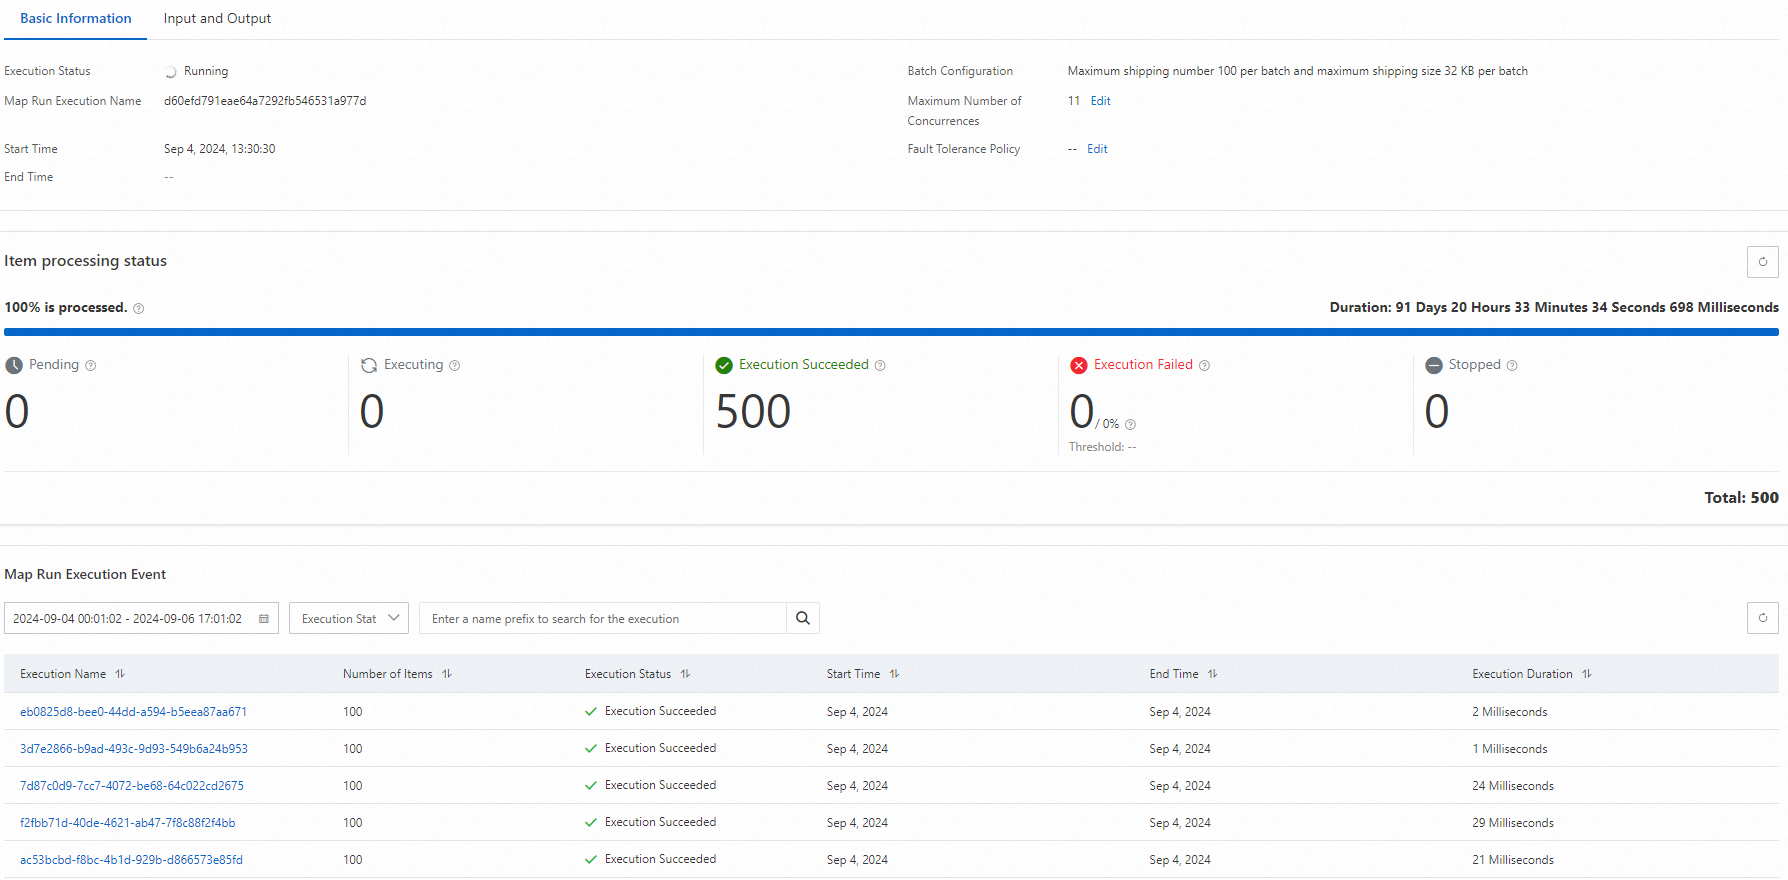
Map Run details
If the state machine contains Map states, a Map Run  link appears in the Status Name column. Click Map Run to view execution details for each iteration of the Map state.