Serverless App Engine (SAE) provides various monitoring metrics and data source types. By default, these monitoring metrics are integrated with Alibaba Cloud Managed Service for Prometheus, which integrates with Managed Service for Grafana. You can view preset dashboards in Managed Service for Grafana Shared Edition or perform secondary development on SAE monitoring data by creating a paid Grafana workspace.
Prerequisites
SAE is activated and an SAE application is created. For more information, see Application deployment.
Usage notes
You can access the SAE preset Grafana dashboards for a single application, including the basic monitoring dashboard and the Application Real-Time Monitoring Service (ARMS) application monitoring dashboard.
You can configure custom monitoring dashboards based on your business requirements. For example, you can access and configure a Grafana observability dashboard, including statistics and top N dashboards for all metrics of all applications, jobs, instances, and change orders. This feature enables one person to implement easy O&M on hundreds or thousands of applications in an efficient manner.
You can configure alert rules for all SAE metrics by using Prometheus, ensuring the continuity and high availability of services.
For more information, see What is Managed Service for Grafana? and Grafana.
Access the feature portal
Log on to the SAE console. In the left-side navigation pane, choose . On the Applications page, select a region in the top navigation bar and a namespace from the Namespace drop-down list, and then click the desired application name.

In the left-side navigation pane of the application details page, click Basic Monitoring. In the prompt message at the top of the page, click View Details.
Basic monitoring dashboard: After you click View Details, the basic Grafana monitoring dashboard appears. For more information, see Access the basic Grafana monitoring dashboard for a single application.
Application monitoring dashboard: In the basic Grafana monitoring dashboard, click the
 icon in the left-side navigation pane. The Grafana search page appears. To view the application monitoring dashboard for an application, search for the
 armskeyword, find the directory starting witharms-metrics-<Region in which your application resides>-, expand the directory, and then view specific monitoring metrics. For more information, see Access the Grafana dashboard for a single application monitored by using ARMS.
Access the basic Grafana monitoring dashboard for a single application
The dashboard shows the monitoring metrics for all instances and a single application, including the following metrics:
CPU utilization
Average system load
Memory usage
Inbound and outbound network rate
Network packets
Disk usage
Disk IOPS
Disk throughput rate
TCP connections
Access the Grafana dashboard for a single application monitored by using ARMS
The built-in ARMS in SAE is suitable for Java applications.
This dashboard shows monitoring metrics for APIs, applications, databases, and machines. For more information about metric description, see Application monitoring metrics.
API (Application overview view)
The application overview view shows monitoring metrics for an application and upstream and downstream links, including the number of requests, the response time, and the number of errors.
Application (Application details view)
The application details view shows monitoring metrics for service calls (provided and invoked services), Java virtual machine (JVM), and instances.
Database (View of the database associated with an application)
The database view shows monitoring metrics, including the number of requests, the number of errors, the response time, and connection pool-related metrics.
Machine (Application instance view)
The application instance view shows monitoring metrics for a specific instance of an application, including CPU, memory, load, disk, network traffic, and network packets.
Configure a global Grafana observability dashboard for multiple applications
You are charged for creating a Grafana workspace. For more information, see Billing rules.
If the basic and application monitoring dashboards cannot meet your requirements, you can configure a global observability dashboard to tailor comprehensive and detailed data. This helps in promptly identifying current issues, preventing potential risks, and analyzing future trends from a global perspective.
Create a Grafana workspace. For more information, see Create and manage a Grafana workspace.
You can view the created workspace on the Workspace Management page.
On the Workspace Management page, click the name of the desired workspace. In the Cloud Service Integration section of the Workspace Information page, integrate SAE data sources.
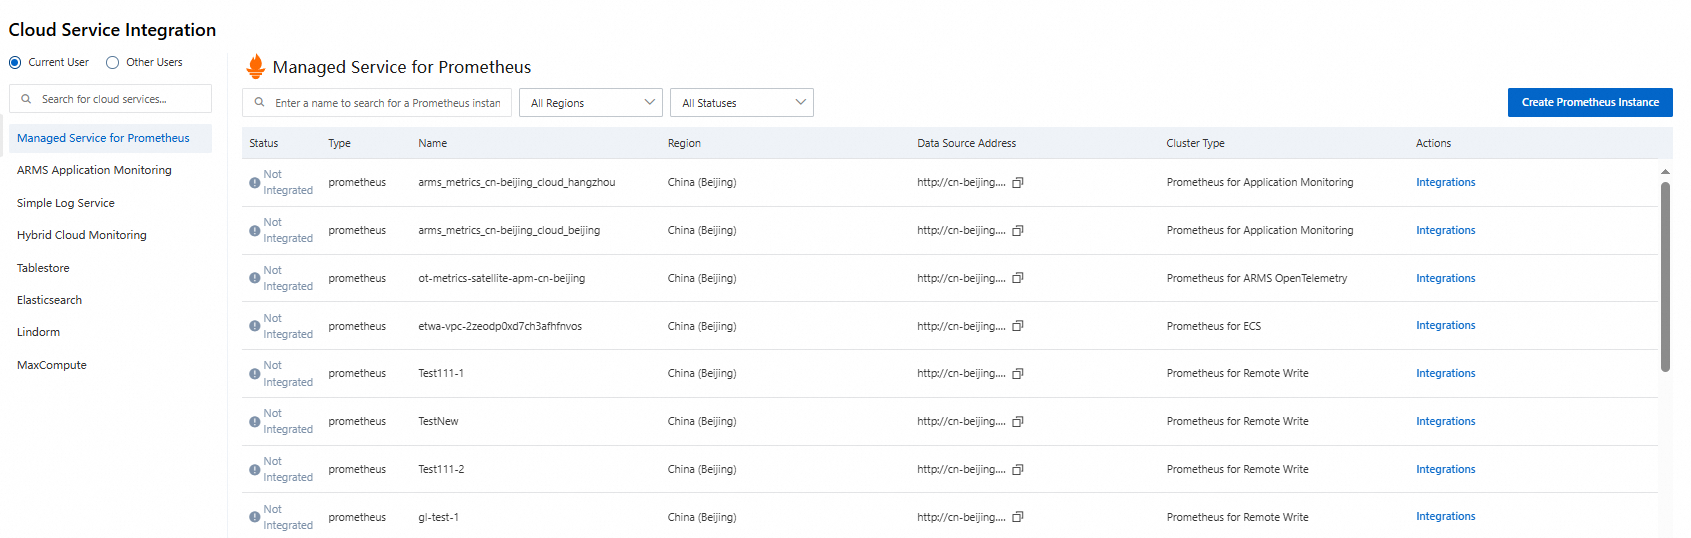
Integrate SAE data sources, including basic monitoring data and SAE platform-related data.
In the cloud service integration list, click Managed Service for Prometheus and integrate the self-monitoring data sources of cloud services in specific regions.
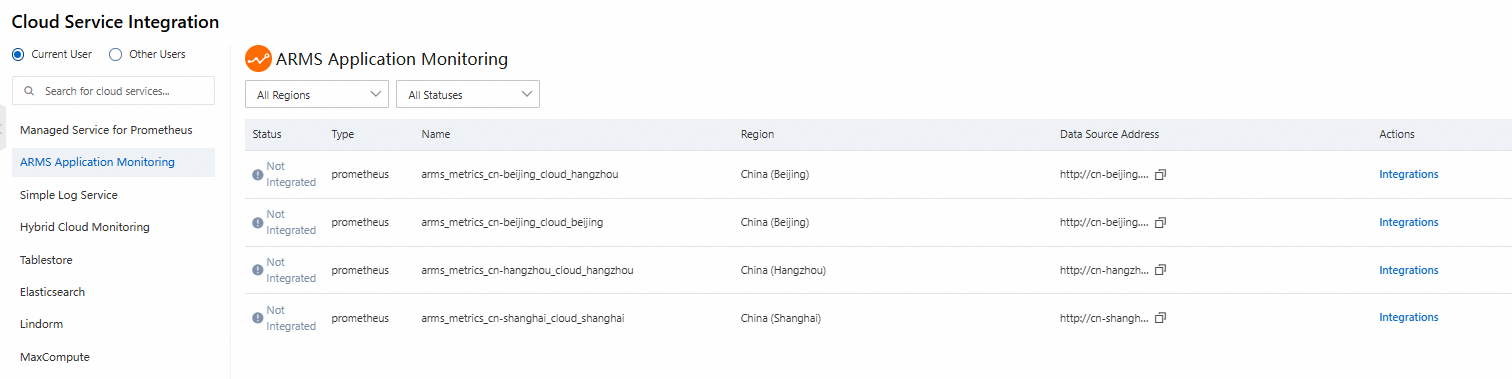
Integrate ARMS data sources, including SAE application monitoring data.
In the cloud service integration list, click ARMS Application Monitoring and integrate the data sources in specific regions.
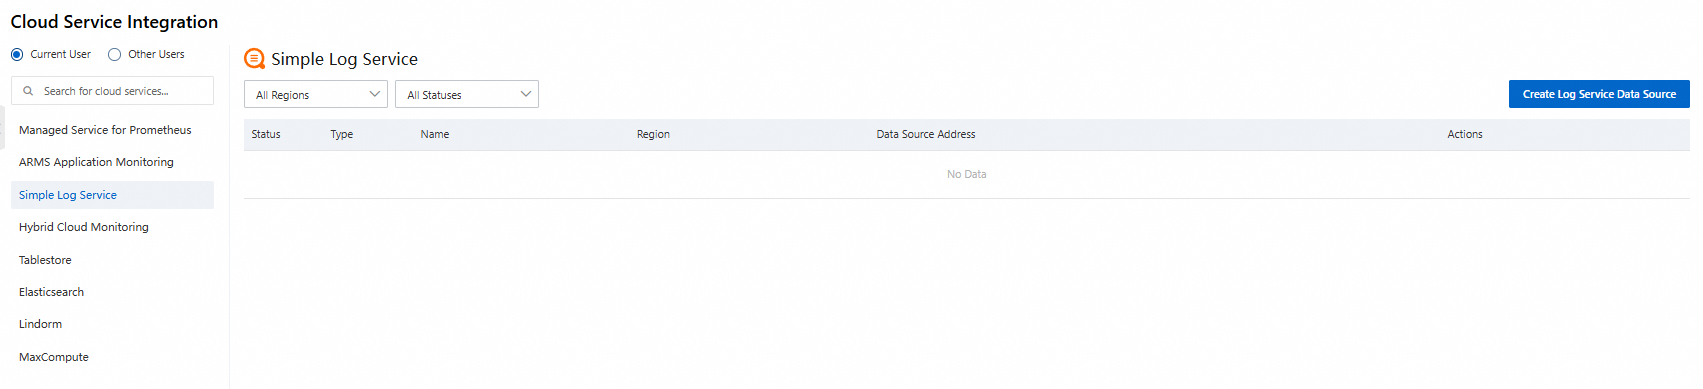
Integrate Simple Log Service data sources, including SAE events.
In the cloud service integration list, click Simple Log Service and integrate the required data sources. For more information, see Integrate cloud services.
When you create a data source, set the Project parameter to
aliyun-product-data-{userId}-{regionId}and the logstore parameter tosae_event.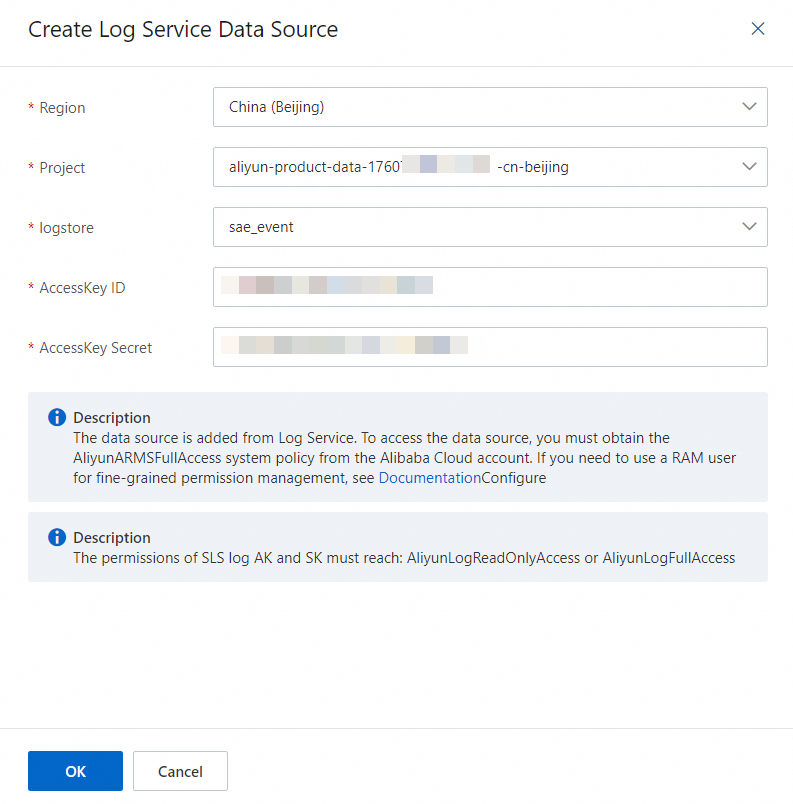 Note
NoteYou must re-deploy the applications that are not deployed before April 28, 2023 to generate data.
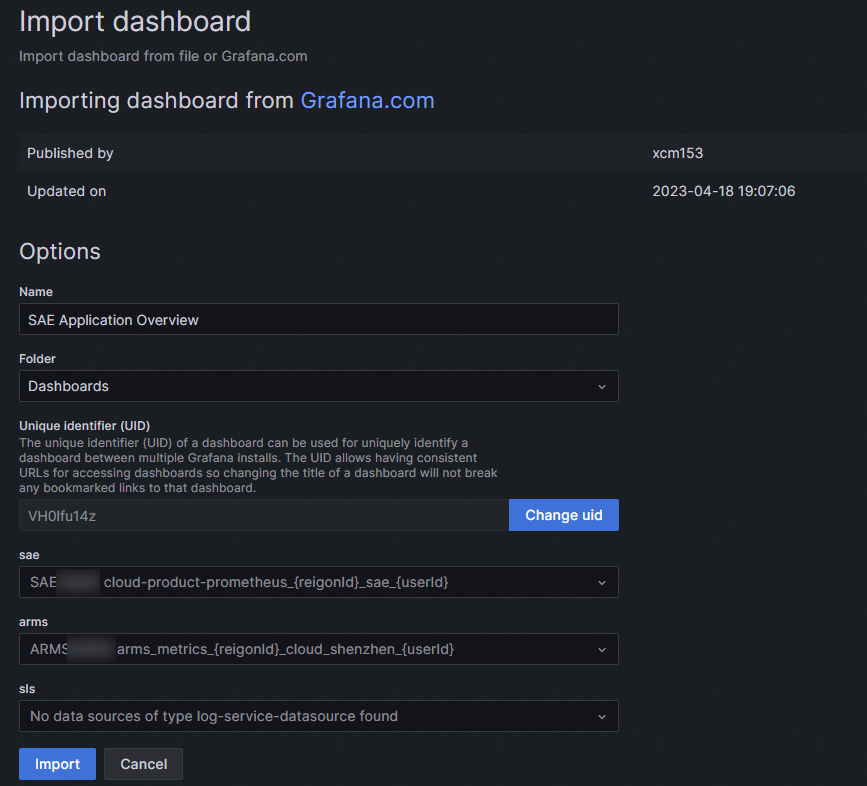
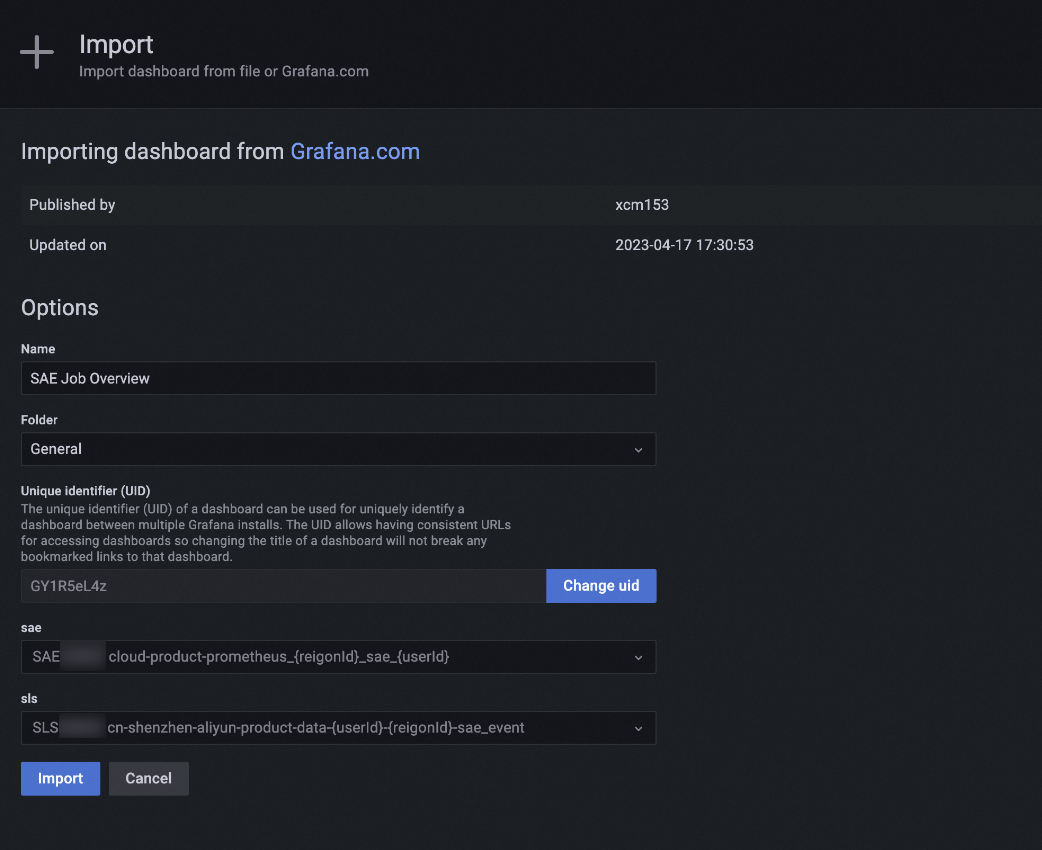
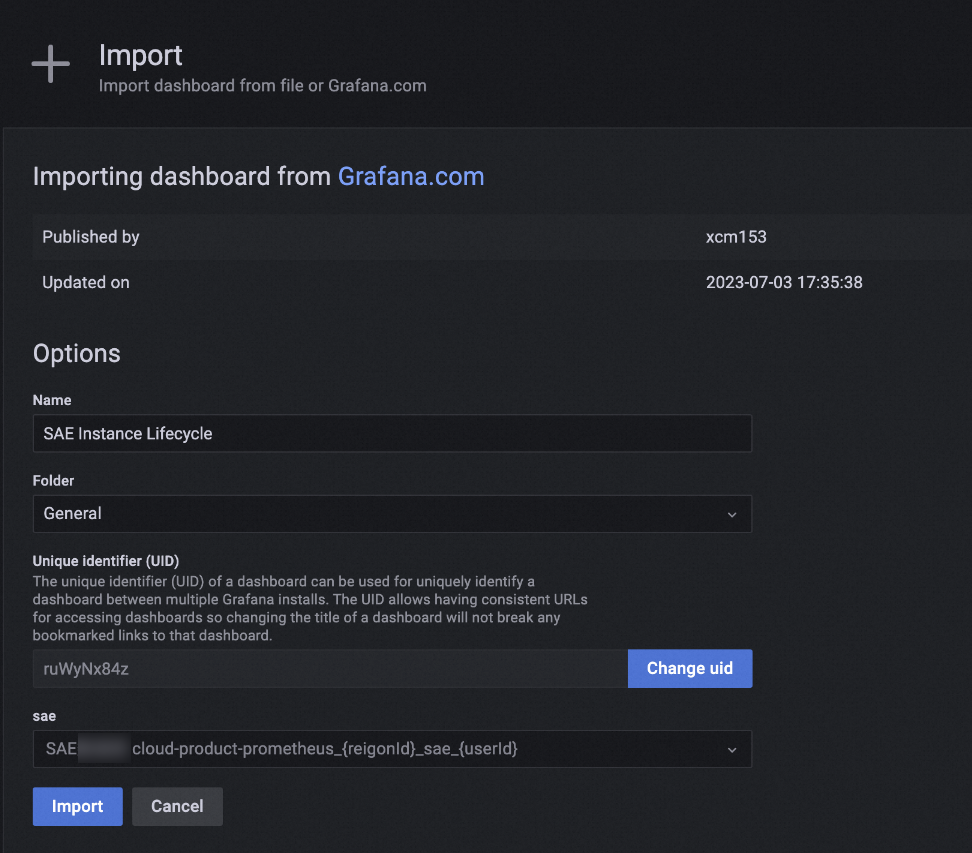
Import dashboard templates in Grafana.

Configure alert rules for SAE metrics by using Prometheus
You are charged for creating a Grafana workspace. For more information, see Billing rules.
By integrating SAE data sources to Managed Service for Prometheus, you can configure monitoring alerts for key SAE metrics in terms of applications, jobs, instances, and change orders to ensure the continuity and high availability of services.
Supported SAE metrics
The following tables describe preset SAE metrics in Prometheus.
Configure alert rules
Integrate SAE data sources.
Create a Grafana workspace. For more information, see Create and manage a Grafana workspace.
You can view the created workspace on the Workspace Management page.
On the Workspace Management page, click the name of the desired workspace. In the Cloud Service Integration section of the Workspace Information page, integrate SAE data sources.
Integrate SAE data sources, including basic monitoring data and SAE platform-related data.
In the cloud service integration list, click Managed Service for Prometheus and integrate the self-monitoring data sources of cloud services in specific regions.
Configure alert rules.
After you integrate SAE data sources, log on to the Prometheus console and create alert rules. For more information, see Create an alert rule for a Prometheus instance.