In CloudDBA, you can view the real-time performance of your Tair instance, including metrics such as memory usage, QPS (queries per second), network traffic, server information, key information, and connection information.
Procedure
Log on to the console and go to the Instances page. In the top navigation bar, select the region in which the instance that you want to manage resides. Then, find the instance and click the instance ID.
-
In the left-side navigation pane, click .
-
View metrics on the Global Real-time Node Performance and Real-time Performance tabs.
-
Global Real-time Node Performance
This tab displays real-time performance metrics for each node in the instance, such as memory usage, QPS, network traffic, and key information.
NoteThis feature is available only for instances that use read/write splitting or cluster architecture.
-
Real-time Performance
Note-
For instances that use read/write splitting or cluster architecture, you can select a specific node to view its performance metrics.
-
Metrics refresh automatically every 5 seconds to help you track performance changes. The upper-right corner displays the number of remaining refreshes. You can also click Pause to stop the automatic refresh.
The top of the page displays real-time performance metrics for the instance, including server information, key information, memory information, and connection information.
The Server Information section includes the version, port, and uptime. The Key Information section shows the total number of keys and the number of keys with an expiration set. The Memory Information section details the maximum memory and used memory. The Connection Information section lists the number of established connections and rejected connections.
The bottom of the page displays detailed performance metrics as Real-time Charts and Real-time Tables.
Format
Description
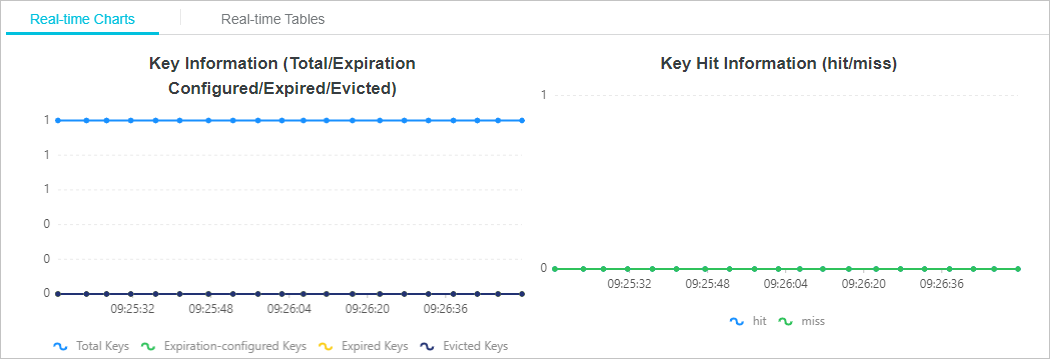
Real-time Charts
These line charts display real-time performance metrics for the instance, including key information, key hit information, key hit ratio, memory usage, QPS, and network traffic.
Real-time Tables
This table displays performance metrics for the instance, such as key hit information, key hit ratio, QPS, memory usage (Memory), CPU utilization, network traffic (Network), client information, and connection information. A new row of real-time values appears every 5 seconds. The table can display a maximum of 999 rows.
-
-