Connection timeouts in Tair (Redis OSS-compatible) are most often caused by slow commands. Slow logs identify which commands exceed your latency threshold and which clients send them, giving you a starting point for optimization.
How it works
Slow logs capture commands that take longer than a configured threshold to execute. Tair generates slow logs on two types of nodes, each measuring latency differently:
| Node type | What the execution duration measures | Recommended for timeout troubleshooting |
|---|---|---|
| Data node | Time to run the command on the data node only. Excludes network transmission and queue wait time. | No — use as a secondary reference |
| Proxy node | Time from when the proxy sends the request to the data node until it receives the response. Includes data node execution time, network transmission, and queuing latency. | Yes — closest to the latency your application observes |
Standard instances do not have proxy node slow logs. If you are using a standard instance, go directly to step 3 and analyze data node slow logs.
The methods described in this topic are not supported for Redis Open-Source Edition 2.8 instances. In the console, go to CloudDBA > Slow Queries to view slow logs for those instances. Slow logs for Redis Open-Source Edition 2.8 instances do not include client IP addresses.
Slow log retention and storage
Both data node and proxy node slow logs are retained for 72 hours, with no limit on the number of entries stored.
In most cases, few slow query logs are generated on data nodes due to high instance performance.
Parameters
Data node parameters
| Parameter | Default | Unit | Description |
|---|---|---|---|
slowlog-log-slower-than | 20000 | Microseconds | Commands that exceed this threshold are recorded. 20,000 microseconds equals 20 milliseconds. Actual observed latency is typically higher because this value excludes network and queue time. |
slowlog-max-len | 1024 | Entries | Maximum number of slow log entries stored. |
Proxy node parameters
| Parameter | Default | Unit | Description |
|---|---|---|---|
rt_threshold_ms | 500 | Milliseconds | Commands that exceed this threshold are recorded. Set this close to your client timeout period (200–500 ms). |
To adjust these parameters, see Configure instance parameters.
Query slow logs
Data node slow logs
Use any of the following methods:
Run
SLOWLOG GETfrom a Redis client. See the SLOWLOG command reference for syntax.View logs in the console or call the API: Query slow logs | DescribeSlowLogRecords
Proxy node slow logs
View logs in the console or call the API: Query slow logs | DescribeSlowLogRecords
Troubleshoot timeout issues
Follow these steps to identify the command causing timeouts:
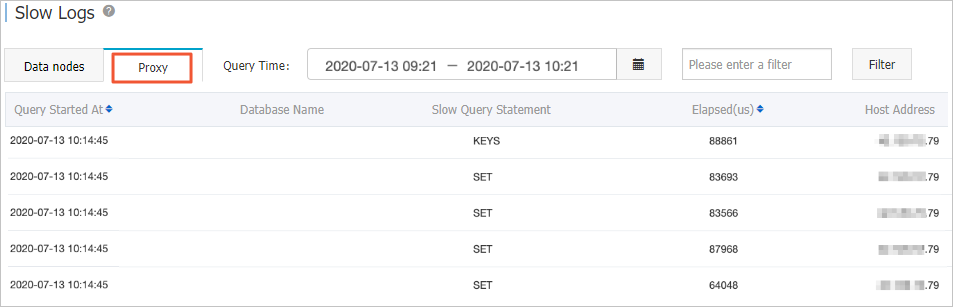
Check proxy node slow logs. Open Query slow logs in the console and select the Proxy tab.
If no proxy node slow logs exist, the issue is likely in the network between the client and the instance rather than in command execution.
For standard instances, skip to step 3.
Find the earliest slow log entry on the proxy node. The earliest entry identifies the command that triggered the cascade of slow requests. The client IP address in the entry shows which client sent the command. In the following example, the earliest slow log entry is for the
KEYScommand. The IP address on the right side of the entry is the client that sent it.NoteWhen slow commands accumulate on data nodes, those commands also appear in proxy node slow logs.
Verify the command in data node slow logs. Switch to the Data nodes tab and check whether the same command appears there. Commands that appear first in proxy node slow logs typically also appear in data node slow logs. Data node slow logs usually contain fewer entries than proxy node slow logs because the two node types use different time measurement definitions and thresholds. In the following example, the
KEYScommand that appeared in the proxy node slow logs also appears in the data node slow logs. No other proxy node entries match data node entries. This confirms that theKEYScommand is causing the timeouts.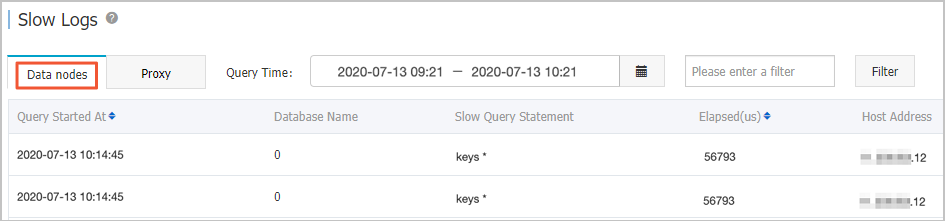
Search for the client IP address in proxy node slow logs. Use the command identified in step 2 to filter entries and locate all clients sending that command. Contact the team responsible for those clients to optimize the command usage.
What's next
Configure instance parameters — adjust slow log thresholds
Query slow logs — view slow logs in the console
DescribeSlowLogRecords — retrieve slow logs via API