Securities firms receive near-real-time price feeds from stock exchanges and must compute candlestick values at high throughput with minimal latency. TairSearch — an in-memory, full-text search data structure that integrates caching and computing for real-time data retrieval — handles this by keeping hot data in memory and computing open, high, low, and close (OHLC) prices directly from the index.
This tutorial shows how to build a 3-minute candlestick for a stock using TairSearch: schema creation, data ingestion, and querying each OHLC value in real time.
Prerequisites
Before you begin, make sure you have:
An Alibaba Cloud ApsaraDB for Redis instance with TairSearch enabled
A Redis client connected to the instance
For TairSearch command reference, see Search.
How candlestick values map to queries
Each candlestick represents four price points over a fixed time window:
| Value | Meaning | Query strategy |
|---|---|---|
| Open | First traded price in the period | Sort by date ascending, return 1 result |
| High | Highest traded price in the period | Aggregation: max on the high field |
| Low | Lowest traded price in the period | Aggregation: min on the low field |
| Close | Last traded price in the period | Sort by date descending, return 1 result |
Open and close prices require sorting to find the first or last record. High and low prices require aggregations that scan all records in the window without returning individual documents. This difference directly affects query performance — see Performance data for benchmark results.
Create a schema for the stock
Use TFT.CREATEINDEX to create a schema with the stock code as the key. In this example, the stock code is 58Z074 and a new price record arrives every 3 seconds.
The schema defines seven fields: open, high, low, close, volume, amount, and date. The date field is indexed ("index": true) to support time-range queries. All price and volume fields are stored but not indexed, because they are retrieved through sorting or aggregation rather than filtered directly.
TFT.CREATEINDEX 58Z074 '{
    "mappings": {
        "properties": {
            "high": {"index": false,"type": "double"},
            "low": {"index": false,"type": "double"},
            "open": {"index": false,"type": "double"},
            "close": {"index": false,"type": "double"},
            "volume": {"index": false,"type": "long"},
            "amount": {"index": false,"type": "long"},
            "date": {"index": true,"type": "long"}
        }
    }
}'
Expected output:
OKTo add or modify fields after creation, use TFT.UPDATEINDEX.Add stock price data
Write each price record to the index using TFT.ADDDOC. Each document corresponds to one price snapshot at a specific Unix timestamp:
TFT.ADDDOC 58Z074 '{
    "high": 1237.53,
    "low": 887.54,
    "open": 987.36,
    "close": 997.53,
    "volume": 110,
    "amount": 2809,
    "date": 1659922202
}'
Repeat this command as new price ticks arrive. In this example, a new record is added every 3 seconds.
Query OHLC prices for a 3-minute candlestick
To generate one candlestick, run three TFT.SEARCH queries against a 3-minute time window. The example window spans gte: 1659922200 to lte: 1659922380 — a 180-second range.
Open price — first record in the window, sorted ascending:
TFT.SEARCH 58Z074 '{
    "size": 1,
    "_source": {"includes": "open"},
    "sort": [{"date": {"order": "asc"}}],
    "query": {"range": {"date": {"gte": 1659922200,"lte": 1659922380}}}
}'
Close price — last record in the window, sorted descending:
TFT.SEARCH 58Z074 '{
    "size": 1,
    "_source": {"includes": "close"},
    "sort": [{"date": {"order": "desc"}}],
    "query": {"range": {"date": {"gte": 1659922200,"lte": 1659922380}}}
}'
High and low prices — maximum and minimum across all records in the window, using aggregations with size: 0 so no documents are returned:
TFT.SEARCH 58Z074 '{
    "size": 0,
    "query": {"range": {"date": {"gte": 1659922200,"lte": 1659922380}}},
    "aggs": {"high": {"max": {"field": "high"}},"low": {"min": {"field": "low"}}}
}'
Combine the results from all three queries to form a single candlestick for the 3-minute window.
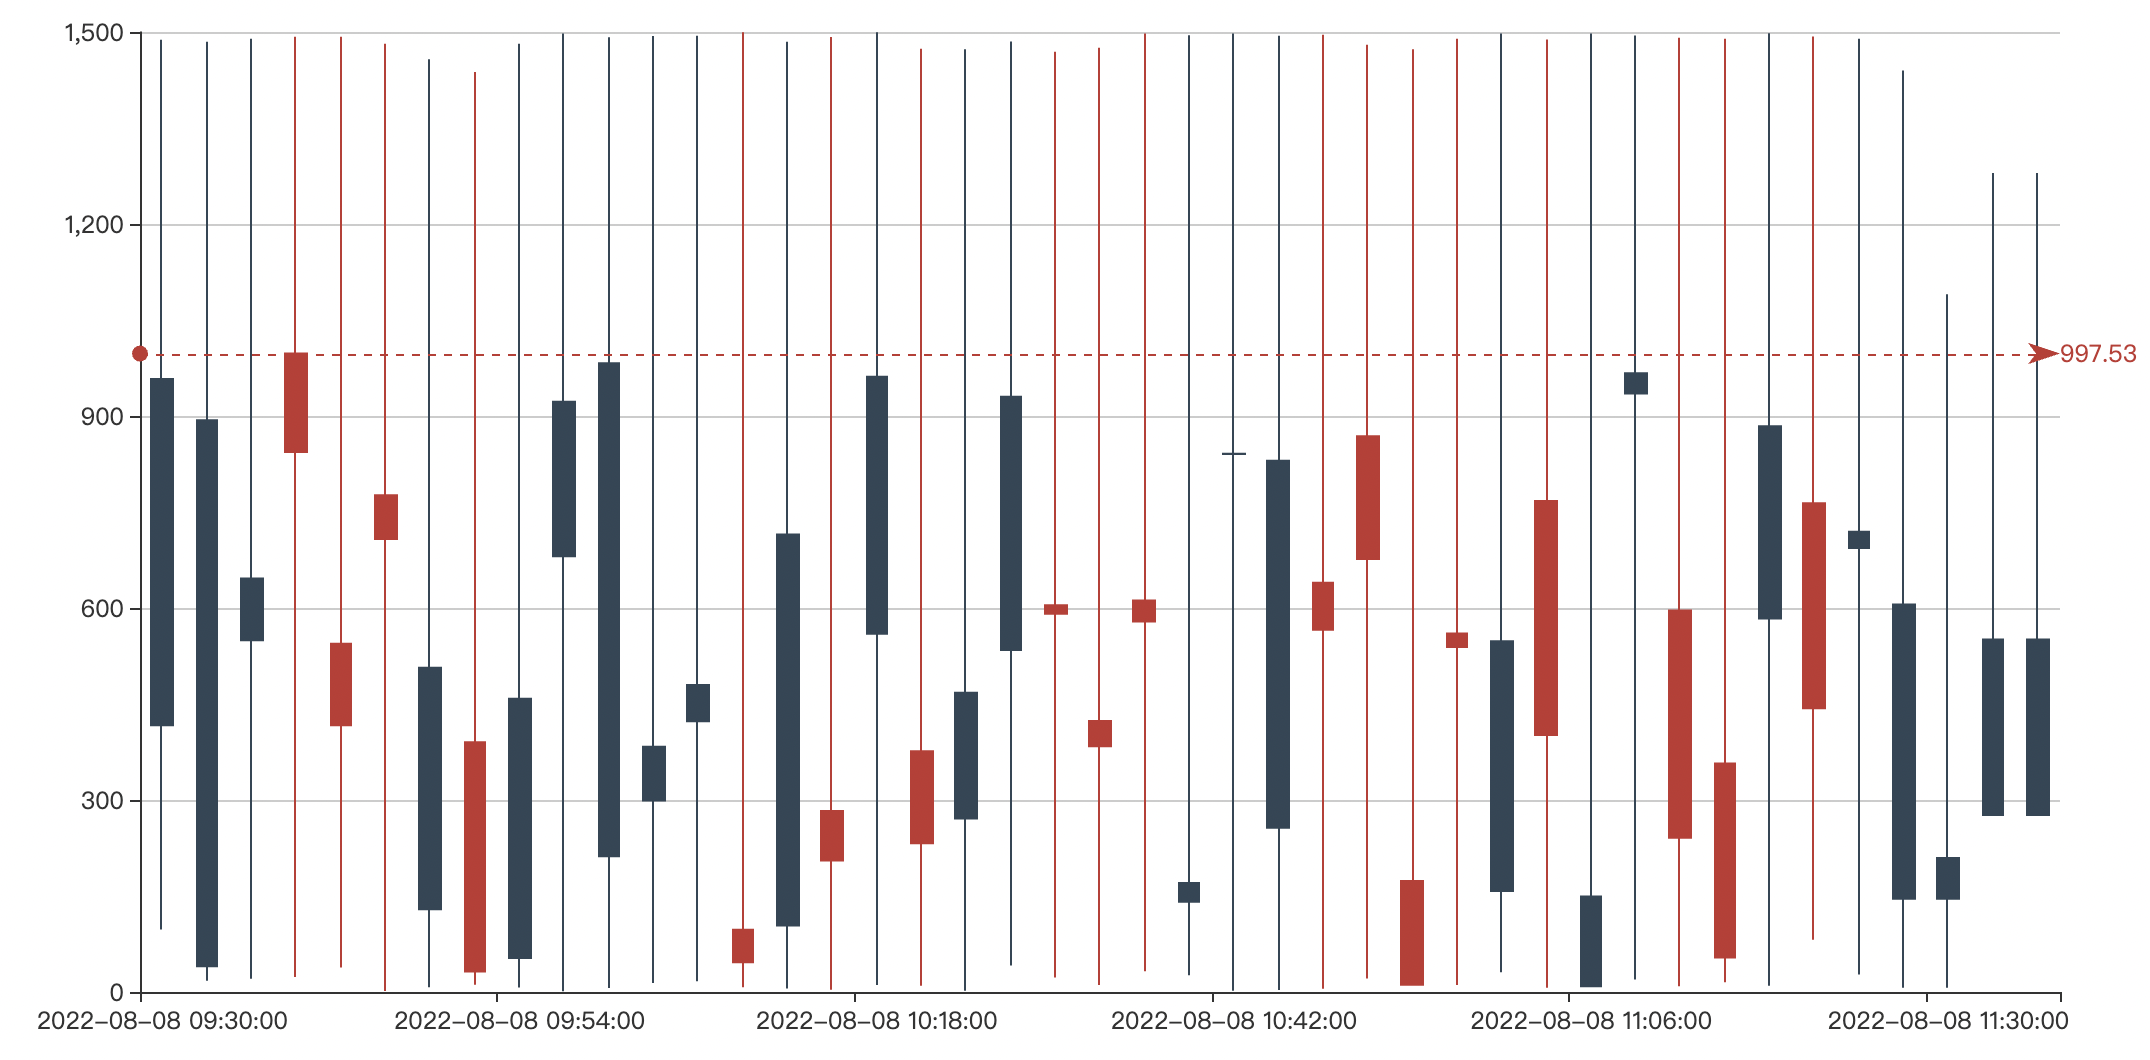
Visualize the candlestick chart
The following chart shows a sample candlestick chart generated from TairSearch data using the Pyecharts library.
Performance data
The following benchmarks use redis-benchmark with 100,000 requests (-n 100000) against a single key (-r 1).
Open and close prices (sort-based queries):
redis-benchmark -r 1 -n 100000 TFT.SEARCH 58Z074 '{"size": 1, "_source": {"includes": "open"}, "sort": [{"date": {"order": "asc"}}], "query": {"range": {"date": {"gte": 1659922200,"lte": 1659922380}}}}'Output:
100.00% <= 5 milliseconds
12078.75 requests per second
High and low prices (aggregation-based queries):
redis-benchmark -r 1 -n 100000 TFT.SEARCH 58Z074 '{"size": 0,"query": {"range": {"date": {"gte": 1659922200,"lte": 1659922380}}},"aggs": {"high": {"max": {"field": "high"}},"low": {"min": {"field": "low"}}}}'Output:
100.00% <= 2 milliseconds
65019.51 requests per second
Aggregation queries (high and low) are significantly faster than sort-based queries (open and close) because they compute across the index directly without retrieving or sorting individual documents.