This whitepaper covers the test environment, tool, methodology, and results for performance testing of Tair (Enterprise Edition) ESSD-based instances.
These results reflect a specific test environment and are not performance guarantees or SLA commitments. Run your own benchmarks against your actual workload to determine the right instance type for your application.
Test environment
| Item | Description |
|---|---|
| Region and zone | Hangzhou Zone I |
| Instance architecture | Standard master-replica architecture. See Standard architecture. |
| Stress testing machine | Elastic Compute Service (ECS) instance of the ecs.g6e.13xlarge type. See Overview of instance families. |
| ESSD instance types tested | tair.essd.standard.xlarge, tair.essd.standard.2xlarge, tair.essd.standard.4xlarge, tair.essd.standard.8xlarge, tair.essd.standard.13xlarge |
Test scenarios
The tests cover two scenarios that produce significantly different performance characteristics:
Memory size larger than data volume — Most data fits in memory (memory:data ratio ≈ 7:1). Read requests are served from memory with minimal disk access.
Data volume larger than memory size — Only part of the dataset is cached. Most requests require disk reads or writes (memory:data ratio ≈ 1:4).
Expect significantly lower QPS in Scenario 2 compared to Scenario 1 for the same instance type. This difference is expected behavior due to the increased disk access required when data exceeds available memory.
Test tool
The tests use YCSB (Yahoo Cloud Serving Benchmark), an open-source Java tool for benchmarking database performance.
The YCSB source code is modified to accept a LONG-typed recordcount value and to test string commands in Redis. Download the modified YCSB source code to reproduce the tests.
Workloads
Each test run uses one of the following workloads. See Core workloads for full YCSB workload definitions.
| Workload | YCSB config | Operations | Purpose |
|---|---|---|---|
| Data loading | workloada | 100% SET (strings) | Populate the dataset before read/update tests |
| Uniform-Read | workloadc + requestdistribution=uniform | 100% GET (random keys) | Measure read throughput under worst-case access distribution |
| Zipfian-Read | workloadc + requestdistribution=zipfian | 100% GET (Zipfian distribution) | Measure read throughput when a small portion of keys receives most traffic — the typical production pattern |
| Uniform-50%Read-50%Update | workloada + requestdistribution=uniform | 50% GET + 50% SET (random keys) | Measure mixed read/update performance |
Run the tests
The commands below run all four workloads sequentially. The example values (recordcount, threads) shown in the script correspond to the tair.essd.standard.xlarge instance in the data-volume-larger-than-memory scenario. Adjust these values to match the instance type you are testing — refer to the per-instance values in the results tables.
Step 1: Load data
./bin/ycsb load redis -s -P workloads/workloada \
  -p "redis.host=${ip}" \
  -p "redis.port=${port}" \
  -p "recordcount=${recordcount}" \
  -p "operationcount=${recordcount}" \
  -p "redis.timeout=${timeout}" \
  -p "redis.command_group=${command_group}" \
  -p "fieldcount=${fieldcount}" \
  -p "fieldlength=${fieldlength}" \
  -threads ${threads}

sleep ${load_sleep_time}   # Allow data to flush to disk before reading
Step 2: Test read throughput (uniform distribution)
./bin/ycsb run redis -s -P workloads/workloadc \
  -p "redis.host=${ip}" \
  -p "redis.port=${port}" \
  -p "recordcount=${recordcount}" \
  -p "operationcount=${run_operationcount}" \
  -p "redis.timeout=${timeout}" \
  -p "redis.command_group=${command_group}" \
  -p "fieldcount=${fieldcount}" \
  -p "fieldlength=${fieldlength}" \
  -p "requestdistribution=uniform" \
  -threads ${threads}

sleep ${run_sleep_time}
Step 3: Test read throughput (Zipfian distribution)
./bin/ycsb run redis -s -P workloads/workloadc \
  -p "redis.host=${ip}" \
  -p "redis.port=${port}" \
  -p "recordcount=${recordcount}" \
  -p "operationcount=${run_operationcount}" \
  -p "redis.timeout=${timeout}" \
  -p "redis.command_group=${command_group}" \
  -p "fieldcount=${fieldcount}" \
  -p "fieldlength=${fieldlength}" \
  -p "requestdistribution=zipfian" \
  -threads ${threads}

sleep ${run_sleep_time}
Step 4: Test mixed read/update throughput
./bin/ycsb run redis -s -P workloads/workloada \
  -p "redis.host=${ip}" \
  -p "redis.port=${port}" \
  -p "recordcount=${recordcount}" \
  -p "operationcount=${run_operationcount}" \
  -p "redis.timeout=${timeout}" \
  -p "redis.command_group=${command_group}" \
  -p "fieldcount=${fieldcount}" \
  -p "fieldlength=${fieldlength}" \
  -p "requestdistribution=uniform" \
  -threads ${threads}
Script parameters
| Parameter | Description |
|---|---|
ip | IP address of the Tair instance |
port | Service port of the Tair instance |
timeout | Command timeout in milliseconds |
command_group | Data type to test. Set to string |
recordcount | Number of keys loaded during the data loading phase. See per-instance values in the results tables |
run_operationcount | Number of operations per test run. For memory > data: set equal to recordcount. For data > memory: set to recordcount ÷ 32 |
fieldcount | Number of fields per key. Set to 1 |
fieldlength | Length of each field in bytes. Set to 100 |
threads | Number of YCSB client threads. The thread counts used in this whitepaper are selected to saturate each instance type. See per-instance values in the results tables |
load_sleep_time | Wait time in seconds after loading data before starting read tests. Set to 600 |
run_sleep_time | Wait time in seconds between consecutive test runs. Set to 60 |
Test metrics
| Metric | Unit | Description |
|---|---|---|
| QPS | ops/sec | Read and write operations processed per second |
| Average latency | µs | Average time per read or write operation |
| 99th percentile latency | µs | The latency threshold below which 99% of operations complete. For example, a value of 500 µs means 99% of operations finish within 500 µs |
Test results
How to read these results
QPS and latency vary significantly between the two scenarios because of how ESSD-based instances handle data access:
Scenario 1 (memory > data): Most reads are served from memory, so QPS is high and latency is low.
Scenario 2 (data > memory): Most reads require disk access, so QPS drops and latency increases. Within this scenario, Zipfian-Read still benefits from hot-key caching and outperforms Uniform-Read significantly.
Expect significantly lower QPS in Scenario 2 compared to Scenario 1 for the same instance type. This is expected behavior, not a defect.
Scenario 1: Memory size larger than data volume
Memory:data ratio ≈ 7:1. Results reflect near-memory-speed performance.
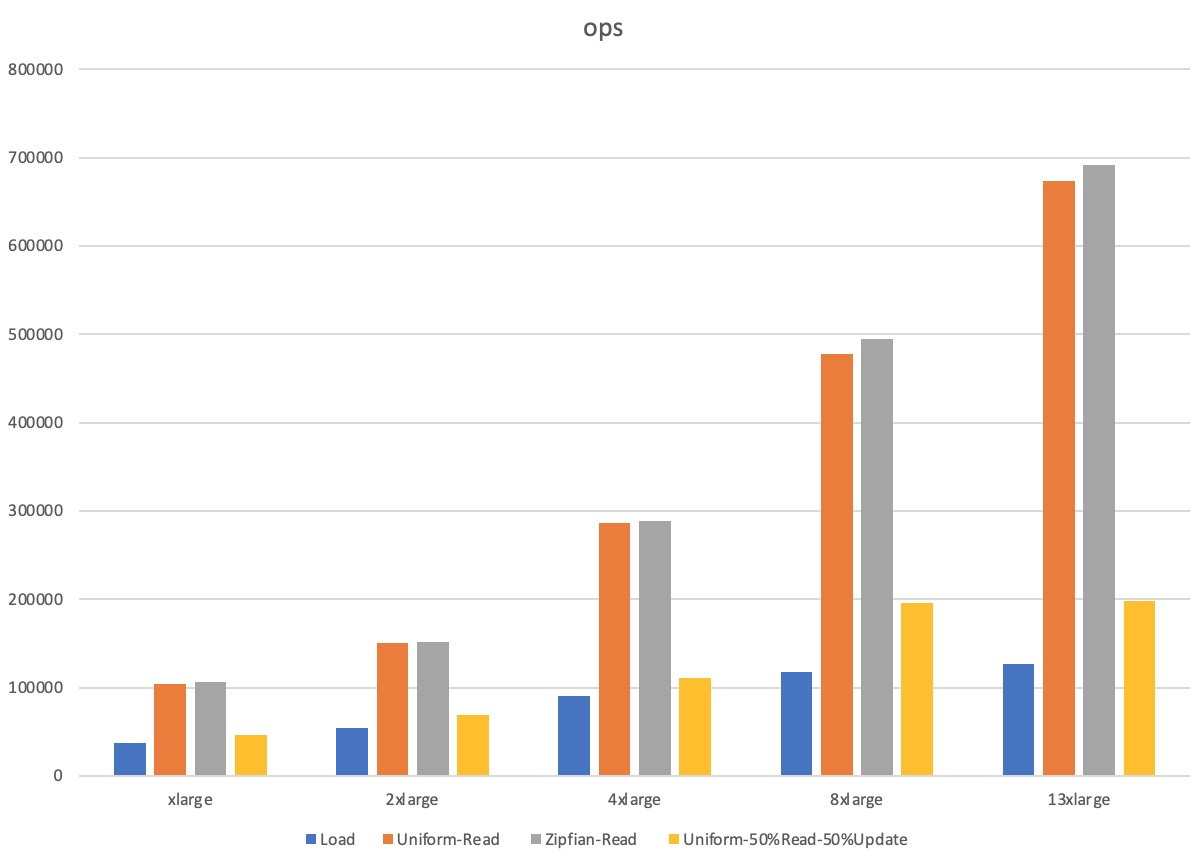
| Instance type | YCSB configuration | Workload | QPS | Average latency (µs) | 99th percentile latency (µs) |
|---|---|---|---|---|---|
| tair.essd.standard.xlarge | recordcount=20,000,000 run_operationcount=20,000,000 threads=32 | Load | 36,740 | 851 | 1,595 |
| Uniform-Read | 103,890 | 294 | 907 | ||
| Zipfian-Read | 106,357 | 288 | 865 | ||
| Uniform-50%Read-50%Update | 46,610 | Read: 530 / Update: 795 | Read: 1,108 / Update: 1,684 | ||
| tair.essd.standard.2xlarge | recordcount=40,000,000 run_operationcount=40,000,000 threads=50 | Load | 54,670 | 911 | 1,528 |
| Uniform-Read | 150,796 | 314 | 995 | ||
| Zipfian-Read | 151,110 | 314 | 977 | ||
| Uniform-50%Read-50%Update | 69,137 | Read: 537 / Update: 878 | Read: 948 / Update: 1,479 | ||
| tair.essd.standard.4xlarge | recordcount=80,000,000 run_operationcount=80,000,000 threads=100 | Load | 90,703 | 1,099 | 1,697 |
| Uniform-Read | 285,833 | 339 | 1,196 | ||
| Zipfian-Read | 288,750 | 335 | 1,162 | ||
| Uniform-50%Read-50%Update | 110,316 | Read: 757 / Update: 1,041 | Read: 1,114 / Update: 1,536 | ||
| tair.essd.standard.8xlarge | recordcount=160,000,000 run_operationcount=160,000,000 threads=120 | Load | 117,581 | 1,011 | 1,692 |
| Uniform-Read | 477,099 | 242 | 784 | ||
| Zipfian-Read | 494,550 | 234 | 727 | ||
| Uniform-50%Read-50%Update | 196,245 | Read: 519 / Update: 691 | Read: 829 / Update: 1,096 | ||
| tair.essd.standard.13xlarge | recordcount=240,000,000 run_operationcount=240,000,000 threads=160 | Load | 126,366 | 1,249 | 2,281 |
| Uniform-Read | 673,183 | 231 | 637 | ||
| Zipfian-Read | 691,383 | 230 | 652 | ||
| Uniform-50%Read-50%Update | 197,803 | Read: 678 / Update: 935 | Read: 940 / Update: 1,925 |
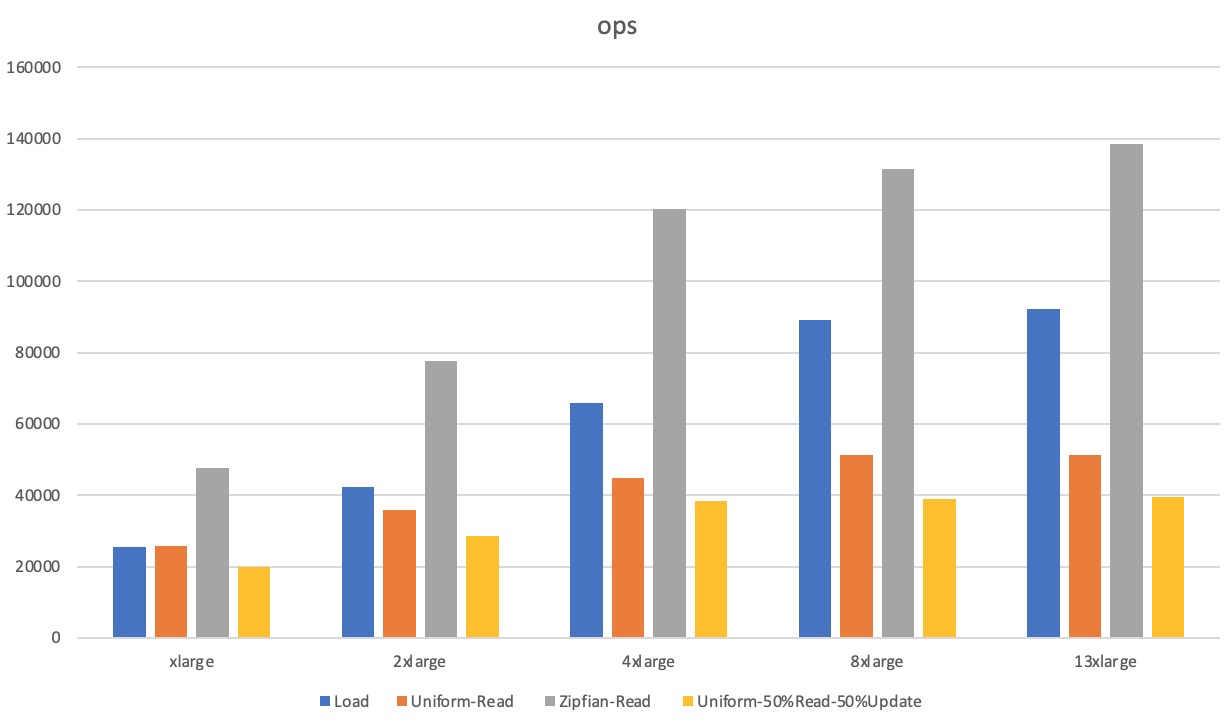
Scenario 2: Data volume larger than memory size
Memory:data ratio ≈ 1:4. Most requests require disk access, so QPS is lower and latency is higher compared to Scenario 1.
| Instance type | YCSB configuration | Workload | QPS | Average latency (µs) | 99th percentile latency (µs) |
|---|---|---|---|---|---|
| tair.essd.standard.xlarge | recordcount=640,000,000 run_operationcount=20,000,000 threads=32 | Load | 25,561 | 1,245 | 3,497 |
| Uniform-Read | 25,727 | 1,239 | 2,042 | ||
| Zipfian-Read | 47,559 | 667 | 1,217 | ||
| Uniform-50%Read-50%Update | 19,731 | Read: 1,576 / Update: 1,639 | Read: 6,383 / Update: 6,487 | ||
| tair.essd.standard.2xlarge | recordcount=1,280,000,000 run_operationcount=40,000,000 threads=50 | Load | 42,287 | 1,179 | 3,465 |
| Uniform-Read | 35,794 | 1,394 | 1,880 | ||
| Zipfian-Read | 77,759 | 637 | 1,219 | ||
| Uniform-50%Read-50%Update | 28,656 | Read: 1,716 / Update: 1,761 | Read: 8,863 / Update: 8,951 | ||
| tair.essd.standard.4xlarge | recordcount=2,560,000,000 run_operationcount=80,000,000 threads=100 | Load | 65,923 | 1,514 | 6,615 |
| Uniform-Read | 44,753 | 2,232 | 7,903 | ||
| Zipfian-Read | 120,337 | 826 | 1,382 | ||
| Uniform-50%Read-50%Update | 38,470 | Read: 2,577 / Update: 2,617 | Read: 8,535 / Update: 8,583 | ||
| tair.essd.standard.8xlarge | recordcount=5,120,000,000 run_operationcount=160,000,000 threads=120 | Load | 89,231 | 1,340 | 9,575 |
| Uniform-Read | 51,175 | 2,343 | 2,955 | ||
| Zipfian-Read | 131,317 | 911 | 1,573 | ||
| Uniform-50%Read-50%Update | 38,930 | Read: 3,063 / Update: 3,097 | Read: 8,695 / Update: 8,735 | ||
| tair.essd.standard.13xlarge | recordcount=7,680,000,000 run_operationcount=240,000,000 threads=160 | Load | 92,163 | 1,733 | 9,879 |
| Uniform-Read | 51,267 | 3,510 | 16,623 | ||
| Zipfian-Read | 138,522 | 1,152 | 2,131 | ||
| Uniform-50%Read-50%Update | 39,584 | Read: 4,022 / Update: 4,057 | Read: 12,159 / Update: 12,239 |