Read-only RDS instances use MySQL's native log-based asynchronous or semi-asynchronous replication to sync data from the primary instance. This mechanism can introduce replication latency, causing data inconsistencies and, if logs accumulate, storage exhaustion on the read-only instance.
This topic explains how to determine whether a latency is real, identify the root cause, and resolve it.
Understand replication latency
Latency is reported in the Seconds_Behind_Master field of SHOW SLAVE STATUS \G, measured in seconds.
Latency formula: Latency = Current time − Commit time of the transaction being applied on the read-only instance, where "current time" is when you run SHOW SLAVE STATUS \G.
Latency falls into two categories:
| Latency | Meaning | Action |
|---|---|---|
| ≤ 1 second | Caused by sampling precision or cross-second transactions. No actual delay. | Ignore |
| > 1 second | Caused by resource constraints, high write volume, large transactions, or DDL operations | Diagnose and fix |
Why a 1-second latency is often a false reading
ApsaraDB RDS rounds all sampling points down to the nearest second. When a transaction spans a second boundary, the latency calculation yields 1 second even if the actual delay is a fraction of a second.
Example:
| Transaction | Committed on primary | Committed on read-only | Sampled at | Reported latency |
|---|---|---|---|---|
| Trx1 | 00:00:00.30 | 00:00:00.50 | 00:00:00.35 | 0(0.35) − 0(0.30) = 0 s |
| 00:00:00.45 | 0(0.45) − 0(0.30) = 0 s | |||
| Trx2 | 00:00:00.90 | 00:00:01.10 | 00:00:00.95 | 0(0.95) − 0(0.90) = 0 s |
| 00:00:01.05 | 1(1.05) − 0(0.90) = 1 s |
If the monitoring time range is set to 3 hours or more, the default granularity can be as coarse as 30 seconds. To get 1-second granularity, go to the Performance Trends tab in the ApsaraDB RDS console and set the time range to less than 6 minutes. For details, see Use the dashboard feature for an ApsaraDB RDS for MySQL instance.
Set the read latency threshold for your proxy or alert rule to a value greater than 1 second to avoid false alarms.
Diagnose a latency greater than 1 second
Start by running SHOW SLAVE STATUS \G on the read-only instance to collect diagnostic data. Match your output to the patterns below to identify the cause.
Pattern 1: Read-only instance under resource pressure
The read-only instance uses one I/O thread and one SQL thread to replicate data. Both compete for I/O resources. If the instance's input/output operations per second (IOPS) is already high from read queries, replication falls behind.
How to confirm: On the Monitoring and Alerting page of the read-only instance in the ApsaraDB RDS console, check CPU utilization, memory usage, I/O bandwidth, and connection count for resource bottlenecks. Compare the instance type with the primary: if the read-only instance has a smaller instance type, that is likely the cause. See Instance types for standard read-only ApsaraDB RDS for MySQL instances and Instance types for YiTian read-only ApsaraDB RDS for MySQL instances.
Pattern 2: Primary instance has high write throughput
The read-only instance uses a single thread to apply transactions. If the primary is handling concurrent multi-thread writes at a high transactions per second (TPS) rate, the single-threaded applier cannot keep up.
How to confirm: View TPS on the Dashboard page of the instance. For details, see Use the dashboard feature for an ApsaraDB RDS for MySQL instance.
Pattern 3: Large transaction executing
When Seconds_Behind_Master keeps growing while Exec_Master_Log_Pos does not move, the SQL thread is applying a large transaction or a data definition language (DDL) operation. Operations such as UPDATE, DELETE, INSERT...SELECT, and REPLACE...SELECT on large tables generate substantial binary log data. The read-only instance takes the same amount of time to complete the transaction as the primary did — for example, an 80-second deletion on the primary results in an 80-second deletion on the read-only instance.
Note that only one thread can replicate transactions for a given table at a time, even when concurrent multi-table replication is in use.
How to confirm:
-
Run
SHOW SLAVE STATUS \Gand check thatSeconds_Behind_Masteris increasing whileExec_Master_Log_Posis not changing. -
Run
SHOW PROCESSLIST;to identify the specific thread causing the delay.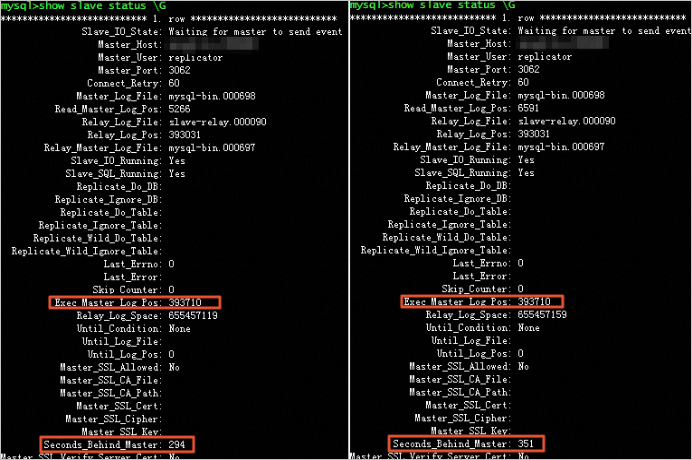
-
If the binary logging format is
ROW, runSHOW BINARY LOGS;and checkFile_size. IfFile_sizeexceedsmax_binlog_size, large transactions are present.
Pattern 4: DDL operation blocking replication
How to confirm:
-
Check whether binary log files are growing without being truncated — this indicates an ongoing DDL operation.
-
Run
SHOW PROCESSLIST;and check whether the SQL thread status showswaiting for table metadata lock. If it does, a query or open transaction on the read-only instance is blocking the DDL statement being replicated from the primary. -
Run
SHOW ENGINE INNODB STATUS \GorSHOW OPEN TABLES;and look for tables within_use = 1— these tables are being modified without a primary key, which forces row-by-row replication. -
Check slow query logs for DDL operations such as
OPTIMIZE,ALTER,REPAIR, andCREATE. See Slow query log analysis.
Common DDL statements that cause long-running latency: CREATE INDEX, REPAIR TABLE, ALTER TABLE ADD COLUMN.
Pattern 5: Table missing a primary key
Tables that have only a unique index with a NULL value and no primary key cause replication to use the unique index execution plan instead of the optimizer's plan — even when a WHERE clause is specified.
How to confirm: Use the sys.schema_index_statistics view to check whether the table has no primary keys and has only a unique index. Also check whether the unique index contains a NULL value.
Solutions
Before making configuration changes, verify your disaster recovery and backup setup to protect against data loss. For RDS instances, enable log backup before proceeding.
Apply the fix that matches your identified cause.
Fix for pattern 1: Upgrade the instance type
Upgrade the read-only instance to an instance type that matches or exceeds the primary instance. This prevents resource contention from causing replication lag. See Change the specifications of an ApsaraDB RDS for MySQL instance.
Fix for pattern 2: Reduce write pressure on the primary
If the primary's TPS is consistently high, split large write operations into smaller batches to reduce the replication load on the read-only instance.
Fix for pattern 3: Break up large transactions
Split large transactions into smaller ones. For DELETE operations, add a WHERE clause to limit the number of rows deleted per batch. This lets the read-only instance process each smaller transaction quickly without accumulating latency.
Fix for pattern 4: Address DDL-related latency
If DDL operations are causing latency:
-
Schedule DDL operations during off-peak hours.
-
Enable automatic storage expansion or set the manual expansion threshold to 90% to prevent storage from running out during DDL. See How do I scale an ApsaraDB RDS instance?
-
Use SQL Explorer to regularly audit slow-running SQL statements. See Use the SQL Explorer and Audit feature on an ApsaraDB RDS for MySQL instance.
-
Set a disk usage alert, configure automatic storage expansion, or manually upgrade the instance type.
If a metadata lock is blocking replication:
-
Run
SHOW PROCESSLIST;on the read-only instance and confirm the SQL thread status iswaiting for table metadata lock. -
Kill the blocking session to resume replication. See Use DMS to release metadata locks.
Fix for pattern 5: Add a primary key
Add an explicit primary key to any table that lacks one. This lets replication use efficient index lookups instead of full table scans.
FAQ
Why does a 1-second latency appear on some read-only instances but not others?
Each read-only instance has its own collection schedule and startup time. If the sampling point on one instance crosses a second boundary, it reports 1 second; if it does not, it reports 0 seconds. This is a measurement artifact, not a real latency difference between instances.
Does a 1-second latency affect my workloads?
No. A reported 1-second latency does not mean replication is actually delayed by one second. For example, if the true latency is 0.1 seconds but the sampling point lands across a second boundary, the reported value is 1 second. Set your proxy or alert threshold above 1 second to avoid unnecessary alerts.
What do I do if the ReplicationInterrupted error appears, or Slave_SQL_Running / Slave_IO_Running alerts fire?
Check the following in order:
-
Storage capacity: If the read-only instance is out of storage, it cannot write binary logs from the primary. Check storage usage in the Usage Statistics section of the Basic Information page.
-
Replication latency: If latency exceeds 5 seconds continuously for 5 minutes, the instance triggers a replication interruption alert. Heavy writes or large transactions on the primary are common causes. To check latency: go to the Basic Information page of the read-only instance, click Monitoring and Alerts in the left navigation pane, click the Standard Monitoring tab, and view the Replication Latency of Secondary Instances(second) metric.
-
Slow queries: Slow queries on the read-only instance significantly increase replication latency. Check slow query logs through one of these paths:
-
Left navigation pane → Logs → Slow Query Logs tab
-
Left navigation pane → Autonomy Services → Slow Query Logs
-
If none of these causes apply, the system will detect and resolve the interruption automatically.