Running out of storage on an RDS for SQL Server instance can cause write failures and prevent backups from completing. This topic explains how to identify which file type is consuming space and how to reclaim or expand storage.
Understand storage space concepts
Before troubleshooting, align on what the space numbers mean:
| Concept | Definition | Notes |
|---|---|---|
| Data space used | Space occupied by actual data stored in database files | Increases on inserts. May not decrease on deletes if allocated space is retained. |
| Data space allocated | File space formatted and reserved for database use | Grows automatically. Does not shrink after deletes unless you run a shrink operation. |
| Data space allocated but unused | The difference between allocated and used space | The maximum amount you can reclaim by shrinking data files. |
| Total file size | The on-disk size of data files or log files | Shown in console metrics and sys.master_files. Includes both allocated and unallocated space. |
Console metrics and most monitoring APIs report file size (allocated), not actual data usage. To see both values at once, query sys.dm_db_file_space_usage or sys.master_files. This distinction determines whether shrinking will free meaningful space.
View space usage
Use any of the following methods to check current space usage:
Method 1 — Basic Information page: Shows only the total current space usage. No breakdown by file type or historical trends.

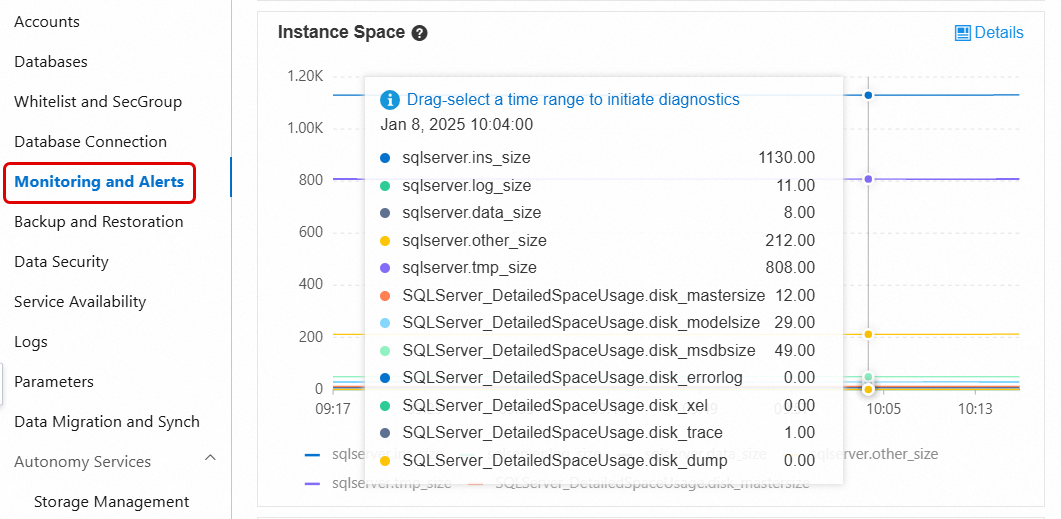
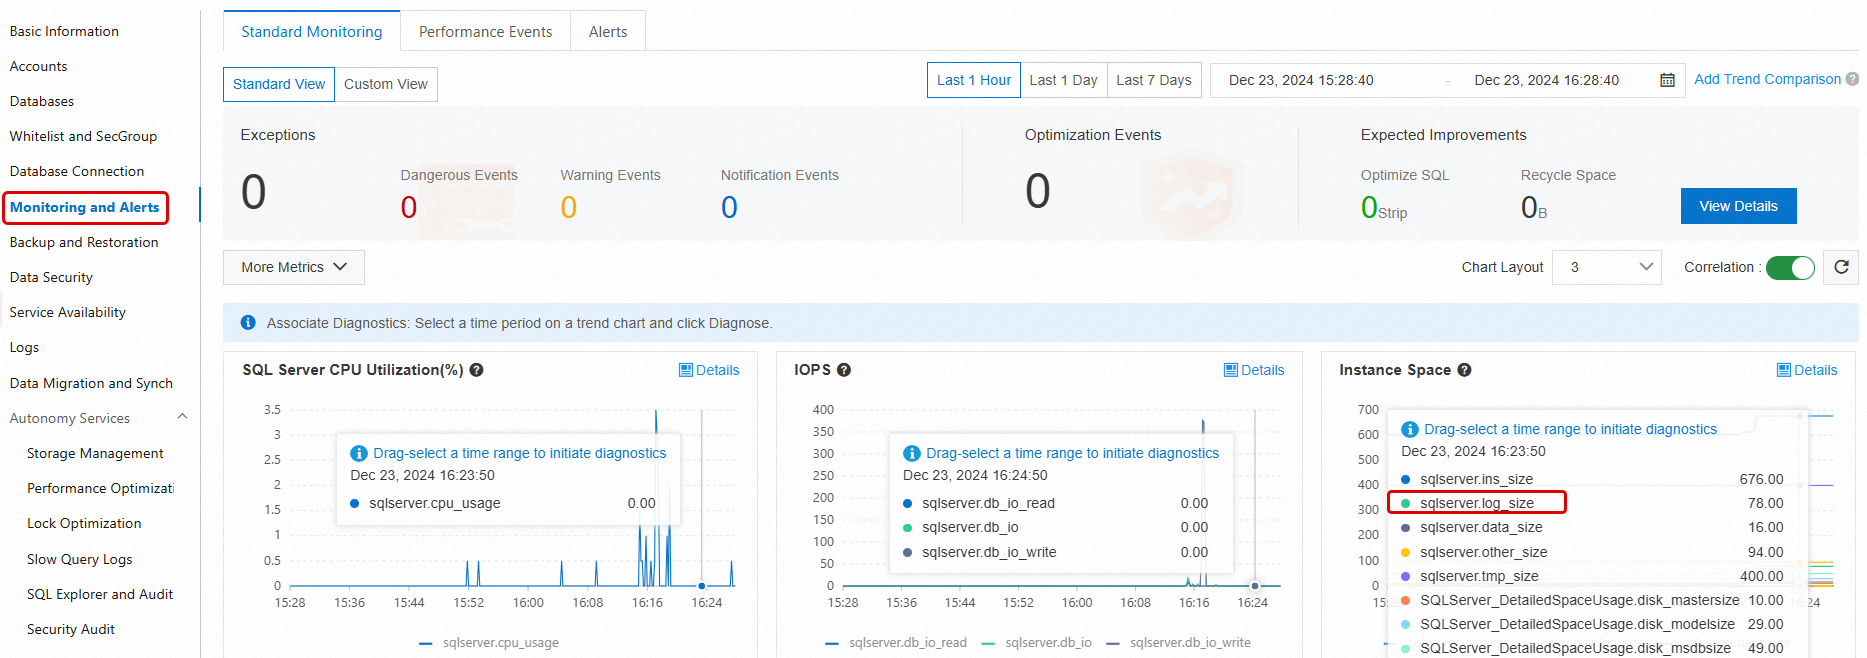
Method 2 — Monitoring and Alerts > Standard Monitoring: Shows disk space broken down by file type (data, log, temp, other) and historical trends. For metric definitions, see View standard monitoring.
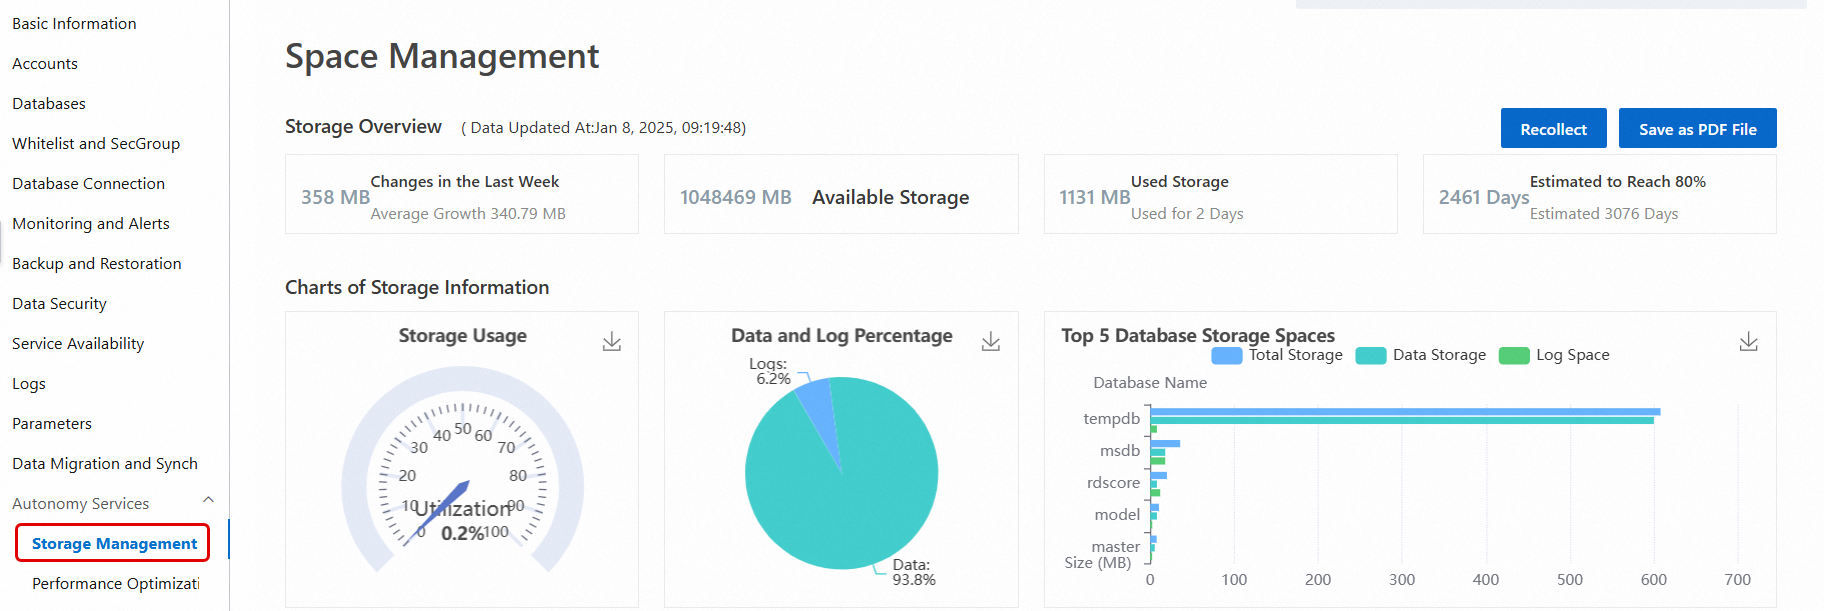
Method 3 — Autonomy Services > Storage Management: Provides a detailed breakdown including data vs. log usage, historical trends, and space allocation for the top databases and tables. For more information, see Space Management.
Storage Management is not available for instances running SQL Server 2008 R2 with cloud disks.
Method 4 — SQL Server Management Studio (SSMS) or another client tool: Connect directly to the instance and run T-SQL queries. For connection instructions, see Connect to an RDS for SQL Server instance using an SSMS client.
The following T-SQL commands are commonly used to inspect space usage:
| Command or view | What it shows |
|---|---|
sp_helpdb | Total size (data files + log files) for each database |
sp_spaceused | Name, used space, and unallocated space for the current database |
DBCC SQLPERF(LOGSPACE) | Total log file size and used log space for each database |
DBCC SHOWFILESTATS | Total and used data space for all data files in the current database |
SELECT * FROM sys.master_files | Data and log file sizes for each database |
SELECT * FROM sys.dm_db_log_space_usage | Total and used log space for the current database. SQL Server 2012 and later only. |
SELECT * FROM sys.dm_db_file_space_usage | Total and used data file space for the current database. SQL Server 2012 and later only. |
If space usage is high, go to Monitoring and Alerts in the RDS console and check which file type is growing fastest — data, log, temp, or other. Then follow the relevant section below.
Reclaim data space
Cause analysis
The tempdb database is a system database in SQL Server that stores temporary data. The data file space in tempdb is frequently used in many scenarios, such as:
User objects: Temporary tables created by users.
Internal objects: Temporary tables generated internally by SQL Server.
Version store: When snapshot isolation or read committed snapshot is enabled for a database, versioning information is stored in
tempdb.
If certain operations, such as long-running transactions, the creation of many temporary tables, or snapshot isolation, use a large amount of space, the data file can become bloated. This means the file size grows significantly beyond its normal range. For more information, see the official Microsoft tutorial for the tempdb database.
Solutions
An RDS for SQL Server database contains data files and log files. The methods to reclaim space for each are as follows:
Reclaiming data file space
If the data file space for tempdb grows large, using the SHRINKFILE command to shrink it is not very effective. Instead, you can restart the instance during off-peak hours to release tempdb space, as described in the official Microsoft tutorial (Shrink the tempdb database).
You can use the following solutions to analyze the space usage of tempdb data files:
If a large amount of tempdb data file space is in use, you can execute the following SQL statement. Use the system view
sys.dm_db_file_space_usageto check thetempdbspace that is used by different object types (User Objects, Internal Objects, and Version Store):For more information about how to use
sys.dm_db_file_space_usage, see the official Microsoft tutorial.SELECT SUM(version_store_reserved_page_count) AS [version store pages used], (SUM(version_store_reserved_page_count) * 1.0 / 128) AS [version store object space in MB], SUM(user_object_reserved_page_count) AS [user object pages used], (SUM(user_object_reserved_page_count) * 1.0 / 128) AS [user object space in MB], SUM(internal_object_reserved_page_count) AS [internal_object pages used], (SUM(internal_object_reserved_page_count) * 1.0 / 128) AS [internal_object space in MB] FROM sys.dm_db_file_space_usage;If User Objects or Internal Objects use a large amount of space:
Execute the following SQL statement. You can use the system view
sys.dm_db_session_space_usageto find which sessions are using a large amount oftempdbspace:For more information about how to use
sys.dm_db_session_space_usage, see the official Microsoft tutorial.SELECT session_id, SUM(user_objects_alloc_page_count) AS [user object pages used], (SUM(user_objects_alloc_page_count) * 1.0 / 128) AS [user object space in MB], SUM(internal_objects_alloc_page_count) AS [internal_object pages used], (SUM(internal_objects_alloc_page_count) * 1.0 / 128) AS [internal_object space in MB] FROM sys.dm_db_session_space_usage GROUP BY session_id;You can use the returned session ID to query the SQL statement that the session is currently executing:
SELECT
    r.session_id AS [SPID],
    r.start_time AS [Start Time],
    r.status AS [Status],
    r.command AS [Command Type],
    r.wait_type AS [Wait Type],
    r.wait_time AS [Wait Time (ms)],
    r.last_wait_type AS [Last Wait Type],
    t.text AS [Executing Statement]
FROM
    sys.dm_exec_requests r
CROSS APPLY
    sys.dm_exec_sql_text(r.sql_handle) t
WHERE
    r.session_id = xxx; ---xxx is the session_id from the previous step
If the Version Store uses a large amount of space, the database might have snapshot isolation enabled. This causes many snapshot versions to be stored in tempdb.
You can query which databases have snapshot isolation enabled:
SELECT
    name,
    is_read_committed_snapshot_on,
    snapshot_isolation_state
FROM sys.databases;
If the value of the
is_read_committed_snapshot_onorsnapshot_isolation_statefield is 1, the corresponding database has snapshot isolation enabled, as shown in the following figure:
You can use the system view
sys.dm_tran_active_snapshot_database_transactionsto check for sessions with long-running transactions that have not been committed. These transactions prevent records in the Version Store from being automatically cleaned up:SELECT * FROM sys.dm_tran_active_snapshot_database_transactions ORDER BY elapsed_time_seconds DESC;The details are as follows:

After you obtain the
session_id, you can querysys.sysprocessesandsys.dm_exec_requests/sys.dm_exec_sql_textto check the session status and the executed command:SELECT * FROM sys.sysprocesses WHERE spid = xxx; --spid is the session_id from the previous stepThe details are as follows:

If the session status is
sleeping, you can use the following SQL command to check the executed statement:DBCC INPUTBUFFER(xxx); --xxx is the session ID (spid) from the previous stepThe details are as follows:

If live data is unavailable, you can analyze the issue using Average Active Sessions (AAS), slow query logs, and audit logs. The steps are as follows:
Analyze the start and end times of the tempdb space growth
First, analyze the growth trend of tempdb space usage. On the instance details page, go to . In the Instance Storage section, note the start and end times when the
tmp_sizemetric increased. When a SQL operation starts, tempdb might still have available free space that is reused first. Therefore, the actual space expansion time might be later than the start time of the SQL operation. The system triggers a file expansion operation to allocate new storage space only after the existing space in tempdb is exhausted.
Analyze using AAS (Average Active Sessions)
On the instance details page, go to . Select the target time period. You should extend the start of the time range to ensure that you capture all related operations. Analyze the SQL execution records in this period to identify any operations that heavily use disk-based temporary tables.
For example, check for the creation and use of temporary tables such as
#RKD_SJ. Frequent use of these temporary tables can be a major cause of tempdb space growth.
Analyze by filtering slow query logs with keywords
On the instance details page, go to . Filter the slow query logs by keyword. Check the SQL running time and start time. You can analyze whether the end time of the query matches the time when the tempdb space stopped growing.

Reclaiming log file space
If the log file space for tempdb grows large, it is usually because a long-running transaction prevents the log from being truncated. You can reclaim the space as follows:
Check the log reuse wait type in the
log_reuse_wait_descfield ofsys.database. If the log reuse wait type isACTIVE_TRANSACTION, a long-running transaction exists.Identify which long-running transactions are running in the
tempdbdatabase. After you end the long-running transactions, you can useSHRINKFILEto shrink the log file.
You can use the following solutions to analyze the space usage of tempdb log files:
First, check the status of the database log file.
In the execution results, check the tempdb log space status. If
LogReuseWaitDescriptionisNOTHING, you can shrink the log file directly withSHRINKFILE. If the value is notNOTHING, such as the common valueACTIVE_TRANSACTION, an active long-running transaction exists. You must end the long-running transaction before you shrink the log file withSHRINKFILE.SELECT name AS [DatabaseName], recovery_model_desc AS [RecoveryModel], log_reuse_wait_desc AS [LogReuseWaitDescription] FROM sys.databases;
Tempdb log file growth is often caused by active long-running transactions. You can use the following SQL command to check for the longest-running transaction in the tempdb database and decide whether to end it:
USE tempdb;
GO
DBCC OPENTRAN;
GO
As shown in the following figure, note the session ID (SPID) and the transaction start time (Start time):

Next, you can check what the session is doing and its status. You can use the session ID from the previous step:
SELECT * FROM sys.sysprocesses WHERE spid = xxx;--spid is the SPID from the previous stepFor example:

If the session status is
sleeping, you can use the following SQL command to check the executed statement:DBCC INPUTBUFFER(xxx); --xxx is the session ID (spid) from the previous stepThe following figure shows an example.

How data space works
Total data space equals the sum of all data file sizes, split into two parts:
Allocated space: Space assigned to tables or indexes. Includes both rows with data and pages reserved for future inserts into the same table or index. Other objects cannot use this space directly.
Unallocated space: Completely free extents (each extent is 64 KB of contiguous space) not associated with any object. Shrinking a file releases this space back to the OS.
If data is still growing, unallocated space is typically small. Shrinking files directly has little effect. Reclaim allocated space first, then consider shrinking.
Reclaim allocated space
Archive or delete data
Delete or migrate infrequently accessed data — for example, old historical records — to another instance or archive format. This directly reduces used data space and is the most effective long-term solution, though it requires changes to application logic and database design.
Compress data
Instances running SQL Server 2016 or later, and Enterprise Edition instances running earlier versions, support row and page compression at the table, index, or partition level. For details, see Data compression.
Savings vary widely (10–90%) depending on schema, column types, and data distribution. Use sp_estimate_data_compression_savings to estimate savings before enabling compression.
Changing compression settings is a Data Definition Language (DDL) operation. On large tables, this can cause long-running table locks. Run it during off-peak hours.
On Enterprise Edition instances, set ONLINE = ON to minimize business impact.Compression increases CPU overhead. Enable it only on large tables where space savings justify the cost.
Defragment indexes
High index fragmentation slows queries and wastes storage. To view fragmentation rates, go to Autonomy Services > Performance Optimization and click the Index Usage tab. The console shows the fragmentation rate per table and suggests whether to rebuild or reorganize each index.
Index fragmentation rate measures the percentage of logically adjacent index pages that are not physically adjacent. This differs from the percentage of free space within pages. To measure average free space per page, querysys.dm_db_index_physical_statsinSAMPLEDorDETAILEDmode and check theavg_page_space_used_in_percentcolumn. For details, see sys.dm_db_index_physical_stats (Transact-SQL). This query reads many index pages — run it during off-peak hours.
Index rebuild (REBUILD): Completely recreates the index. More effective than reorganize for indexes with high fragmentation. By default, locks the table during the operation. On Enterprise Edition instances, set ONLINE = ON to avoid long table locks.
A rebuild temporarily increases database storage and log size significantly. Before rebuilding, verify that the instance has free storage space at least twice the size of the index being rebuilt.
Check free space: go to the Basic Information page of the instance and look at the Instance Resources section.
If free space is insufficient, scale out storage first. The new space takes effect immediately without a restart.
ALTER INDEX <IX_YourIndexName> ON <YourTableName> REBUILD WITH (ONLINE = ON);After the rebuild, the console updates index statistics asynchronously. Click Recollect to get the latest data, then click Export Script to download and verify the fragmentation rate.

Index reorganize (REORGANIZE): Restructures leaf-level pages without locking the table. Less effective than rebuild, but appropriate for indexes with low fragmentation.
Shrink data files
After reclaiming allocated space using the methods above, use one of the following approaches if storage pressure remains.
A single large-scale shrink operation can cause significant transaction log growth and prolonged blocking. Use Method 1 to shrink in small batches.
Method 1 — Incremental shrink loop (recommended)
Shrink in iterations of approximately 5 GB each. The following script applies to SQL Server 2012 and later:
-- This script applies only to SQL Server 2012 and later versions. Specify the following parameters before running.
DECLARE @dbName NVARCHAR(128) = 'YourDBName'  -- Database name
DECLARE @fileName NVARCHAR(128)               -- Data file name
DECLARE @targetSize INT = 2000                -- Target size (MB)
DECLARE @shrinkSize INT = 5120                -- Size to shrink per iteration (MB). 5 GB recommended.
DECLARE @currentSize INT                      -- Current file size
DECLARE @freeSize INT                         -- Unallocated space
DECLARE @usedSize INT                         -- Used space

DECLARE @sql NVARCHAR(500)
DECLARE @waitTime INT = 10                    -- Wait between iterations (seconds)

-- Get the data file name
SELECT @fileName = name
FROM sys.master_files
WHERE database_id = DB_ID(@dbName)
AND type_desc = 'ROWS'

-- Shrink in a loop
WHILE 1 = 1
BEGIN
    -- Get current size and space breakdown
    DECLARE @sql0 NVARCHAR(MAX) = N'
    USE [' + @dbName + '];
    SELECT
      @currentSize = (SUM(total_page_count) * 1.0 / 128),
      @freesize = (SUM(unallocated_extent_page_count) * 1.0 / 128)
    FROM sys.dm_db_file_space_usage
    WHERE database_id = DB_ID();'

    EXEC sp_executesql
      @sql0,
      N'@currentSize INT OUTPUT, @freesize INT OUTPUT',
      @currentSize OUTPUT,
      @freesize OUTPUT

    PRINT 'Current size:' + CAST(@currentSize AS VARCHAR(10)) + 'MB'
    PRINT 'Free size:' + CAST(@freeSize AS VARCHAR(10)) + 'MB'

    SET @usedSize = @currentSize - @freeSize
    PRINT 'Used size:' + CAST(@usedSize AS VARCHAR(10)) + 'MB'

    -- Validate target size
    IF @targetSize <= @usedSize
    BEGIN
        PRINT 'The target size is too small. Specify a new size. The target size cannot be smaller than: ' + CAST(@usedSize AS VARCHAR(20)) + 'MB'
        BREAK
    END

    -- Exit when target is reached
    IF @currentSize <= @targetSize
    BEGIN
        PRINT 'Shrink completed. Current size: ' + CAST(@currentSize AS VARCHAR(20)) + 'MB'
        BREAK
    END

    -- Calculate the new size for this iteration
    DECLARE @newSize INT = @currentSize - @shrinkSize
    IF @newSize < @targetSize
        SET @newSize = @targetSize

    -- Run the shrink
    SET @sql = 'USE [' + @dbName + '];DBCC SHRINKFILE (N''' + @fileName + ''', ' + CAST(@newSize AS VARCHAR(20)) + ')'
    PRINT 'Executing shrink: ' + @sql
    EXEC (@sql)

    -- Wait before the next iteration
    PRINT 'Waiting ' + CAST(@waitTime AS VARCHAR(10)) + ' seconds to continue...'
    WAITFOR DELAY '00:00:10'
END
Method 2 — Direct DBCC SHRINKFILE
Run DBCC SHRINKFILE to shrink a single data file to a target size. This releases unallocated space back to the OS. For reference, see Shrink a database and DBCC SHRINKFILE.
DBCC SHRINKFILE(<File ID>, <Target size in MB>)Example: In the figure below, each extent is 64 KB. Total data file size = (1673344 × 64) / 1024 = 104,584 MB. Allocated space = (1313432 × 64) / 1024 = 82,089.5 MB. The file cannot be shrunk below 82,089.5 MB. To shrink to 90,000 MB, run:
DBCC SHRINKFILE(1, 90000)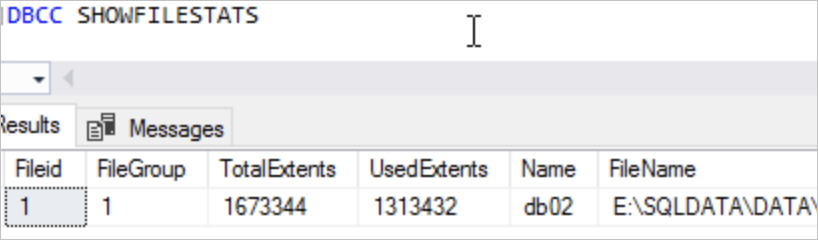
Troubleshoot common data space issues
After a rebuild completes, the console collects updated statistics asynchronously in the background. Click Recollect to trigger a manual refresh. Once collection finishes, click Export Script to download and verify the current fragmentation rate.
In an Alibaba Cloud RDS for SQL Server instance, when you try to execute the SHRINKFILE operation on a database data file or log file to reclaim free space, you may encounter the following issues:
The
SHRINKFILEcommand does not complete for a long time.The progress percentage (
percent_complete) is not updated for a long time.
Such issues are typically caused by long-running transaction blocking, especially when Snapshot Isolation is enabled for the database, because the retention of snapshot versions prevents the SHRINKFILE operation from completing normally.
Solution
The most common cause is a long-running transaction blocking the shrink — especially when snapshot isolation is enabled, which forces SHRINKFILE to wait for snapshot versions to be released.
Follow these steps to diagnose and resolve the issue:
Check the status and progress of the
SHRINKFILEoperation:SELECT r.session_id AS [SPID], r.start_time AS [Start Time], r.status AS [Status], r.command AS [Command Type], r.wait_type AS [Wait Type], r.wait_time AS [Wait Time (ms)], r.last_wait_type AS [Last Wait Type], t.text AS [Executed Statement], r.percent_complete AS [Execution Progress] FROM sys.dm_exec_requests r CROSS APPLY sys.dm_exec_sql_text(r.sql_handle) t;If
statusshowssuspendedandpercent_completehas not changed for an extended period, the operation is blocked.
Check the RDS error log for a message similar to:
DBCC SHRINKFILE for file ID 1 is waiting for the snapshot
transaction with timestamp 15 and other snapshot transactions linked to
timestamp 15 or with timestamps older than 109 to finish.
This confirms that snapshot isolation is causing the block.

Check whether snapshot isolation is enabled on any database:
SELECT
    name,
    is_read_committed_snapshot_on,
    snapshot_isolation_state,
    snapshot_isolation_state_desc
FROM
    sys.databases;
If
is_read_committed_snapshot_on = 1orsnapshot_isolation_state_desc = ON, snapshot isolation is active. Proceed to step 5.
Identify long-running transactions that may be holding snapshot versions:
The blocking transaction may be in a different database — cross-database queries can cause
SHRINKFILEin one database to wait on snapshots in another. Check all related databases.SELECT db_name(exe.database_id), tr.* FROM sys.dm_tran_active_snapshot_database_transactions AS tr JOIN sys.dm_exec_requests AS exe ON tr.session_id = exe.session_id;Focus on
session_idandelapsed_time_seconds. A highelapsed_time_secondsvalue indicates a long-running transaction preventing the shrink from completing.
If a long-running transaction is confirmed as the cause, evaluate whether to terminate it with
KILL. Killing a transaction triggers a rollback — assess the business impact before proceeding. If you cannot terminate the transaction:Wait for it to complete naturally, then retry
SHRINKFILE.Cancel the current
SHRINKFILEoperation and reschedule it for a suitable maintenance window.
Problem description
In an Alibaba Cloud RDS for SQL Server instance, when you try to execute the SHRINKFILE operation on a database data file or log file to reclaim free space, you may encounter the following issues:
The
SHRINKFILEcommand does not complete for a long time.The progress percentage (
percent_complete) is not updated for a long time.
Such issues are typically caused by long-running transaction blocking, especially when Snapshot Isolation is enabled for the database, because the retention of snapshot versions prevents the SHRINKFILE operation from completing normally.
Solution
Connect to the RDS for SQL Server instance using SQL Server Management Studio (SSMS).
Execute the following query to confirm the status and progress of the
SHRINKFILEoperation:SELECT r.session_id AS [SPID], r.start_time AS [Start Time], r.status AS [Status], r.command AS [Command Type], r.wait_type AS [Wait Type], r.wait_time AS [Wait Time (ms)], r.last_wait_type AS [Last Wait Type], t.text AS [Executed Statement], r.percent_complete AS [Execution Progress] FROM sys.dm_exec_requests r CROSS APPLY sys.dm_exec_sql_text(r.sql_handle) t;If the status column shows suspended and the value in the percent_complete column has not updated for a long time, the SHRINKFILE operation is blocked. You can proceed to the next step.
Check the RDS for SQL Server error log for a message similar to the following:
DBCC SHRINKFILE for file ID 1 is waiting for the snapshot
transaction with timestamp 15 and other snapshot transactions linked to
timestamp 15 or with timestamps older than 109 to finish.
Sample result:
This log indicates that because snapshot isolation is enabled for the database, the
SHRINKFILEoperation is blocked by a snapshot transaction and cannot proceed.Run the following query to check whether snapshot isolation is enabled for the database:
SELECT
    name,
    is_read_committed_snapshot_on,
    snapshot_isolation_state,
    snapshot_isolation_state_desc
FROM
    sys.databases;
If
is_read_committed_snapshot_on=1orsnapshot_isolation_state_desc=ON, the snapshot feature is enabled for the database, and you must further investigate for long-running transactions.Run the following SQL statement to check for long-running transactions that might be causing the block and to check their duration:
SELECT db_name(exe.database_id),tr.* FROM sys.dm_tran_active_snapshot_database_transactions AS tr JOIN sys.dm_exec_requests AS exe ON tr.session_id=exe.session_id;After the execution is complete, pay close attention to the
session_idandelapsed_time_secondsfields. Theelapsed_time_secondsfield indicates the transaction duration. A larger value indicates that the transaction has been running for a longer time and requires more attention. If you find that certain long-running transactions are causing blocking, you can consider terminating (KILL) these transactions and observe whether theSHRINKFILEoperation resumes.NoteA blocked
SHRINKFILEoperation is not necessarily caused by long-running transactions in the current database. The root cause can also be long-running transactions in other databases with snapshots enabled, especially in scenarios that involve cross-database queries. Therefore, when you troubleshoot, you must check the transaction status of all related databases to accurately identify and resolve the issue.If you confirm through the preceding steps that one or more long-running transactions are blocking the
SHRINKFILEoperation, you need to evaluate whether you can stop (KILL) these transactions to resume the normal execution of theSHRINKFILEoperation. Note that stopping a long-running transaction causes it to be rolled back. Therefore, before you run theKILLoperation, you must fully evaluate the impact of the rollback on your business. If you cannot stop the long-running transactions for business reasons, see the following suggestions:Wait for the long-running transaction to complete. After it is complete, you can execute the
SHRINKFILEoperation again.Stop the
SHRINKFILEoperation. If the current window is not a suitable time to wait, you can stop theSHRINKFILEoperation and reschedule it for a suitable maintenance window.
Reclaim log space
Check log space usage
Use DBCC SQLPERF(LOGSPACE) or the Monitoring and Alerts page to check the percentage of used space in each database's log file.
If the used percentage is high, shrinking the log file will have little effect. The log cannot be truncated until the blocking condition is resolved. Query sys.databases and check the log_reuse_wait_desc column to identify why truncation is waiting:
SELECT name, log_reuse_wait, log_reuse_wait_desc FROM sys.databases;For a full list of log_reuse_wait_desc values, see sys.databases (Transact-SQL).
Shrink transaction logs
If the transaction log is full, you cannot shrink it from the console. You must run SQL manually, which carries risk. Scale out disk storage first when possible. For emergency procedures, see Solution for insufficient log space (for emergency use only).
Choose the approach that fits your situation:
| Solution 1: Single-database shrink (no backup) | Solution 2: Instance-level backup and shrink | |
|---|---|---|
| Scope | Single database | Entire instance |
| Backup | No backup taken | Automatically backs up all transaction logs first |
| Speed | Fast | Slower — backup runs before shrink |
| Use when | Log is growing fast and you cannot wait for a scheduled backup | Sufficient log space exists and you want global optimization |
| Impact on other databases | None | Affects the entire instance |
| How to run | Shrink database transaction logs | Back up and shrink transaction logs |
After the shrink completes, go to Monitoring and Alerts to verify the updated log space.
Reclaim tempdb space
How tempdb uses space
tempdb is a SQL Server system database that stores temporary data. Three categories of objects consume its data file space:
User objects: Temporary tables created by user sessions (for example,
#TempTable).Internal objects: Temporary structures created by SQL Server internally (for example, for sort operations or hash joins).
Version store: When snapshot isolation or read committed snapshot isolation (RCSI) is enabled, SQL Server stores row versions in
tempdb. Long-running transactions prevent these versions from being cleaned up.
If any of these categories grows large — especially through long-running transactions, heavy use of temporary tables, or snapshot isolation — the tempdb data file can become bloated far beyond its normal size. For background, see the Microsoft tempdb documentation.
Reclaim tempdb data file space
SHRINKFILE is generally ineffective for tempdb data files. The most reliable way to reclaim space is to restart the instance during off-peak hours. SQL Server resets tempdb on startup. For details, see Shrink the tempdb database.
Before restarting, diagnose what caused the growth so you can prevent recurrence.
Scenario 1: tempdb is currently large (live instance)
Step 1 — Check space by object type
Run the following query to see how much space each category (user objects, internal objects, version store) is consuming:
SELECT
    SUM(version_store_reserved_page_count) AS [version store pages used],
    (SUM(version_store_reserved_page_count) * 1.0 / 128) AS [version store space (MB)],
    SUM(user_object_reserved_page_count) AS [user object pages used],
    (SUM(user_object_reserved_page_count) * 1.0 / 128) AS [user object space (MB)],
    SUM(internal_object_reserved_page_count) AS [internal object pages used],
    (SUM(internal_object_reserved_page_count) * 1.0 / 128) AS [internal object space (MB)]
FROM
    sys.dm_db_file_space_usage;
For reference, see sys.dm_db_file_space_usage.
Step 2a — If user objects or internal objects are large
Find which sessions are using the most tempdb space:
SELECT
    session_id,
    SUM(user_objects_alloc_page_count) AS [user object pages used],
    (SUM(user_objects_alloc_page_count) * 1.0 / 128) AS [user object space (MB)],
    SUM(internal_objects_alloc_page_count) AS [internal object pages used],
    (SUM(internal_objects_alloc_page_count) * 1.0 / 128) AS [internal object space (MB)]
FROM
    sys.dm_db_session_space_usage
GROUP BY
    session_id;
For reference, see sys.dm_db_session_space_usage.
Then use the session_id to find the SQL statement the session is running:
SELECT
    r.session_id AS [SPID],
    r.start_time AS [Start Time],
    r.status AS [Status],
    r.command AS [Command Type],
    r.wait_type AS [Wait Type],
    r.wait_time AS [Wait Time (ms)],
    r.last_wait_type AS [Last Wait Type],
    t.text AS [Executing Statement]
FROM
    sys.dm_exec_requests r
CROSS APPLY
    sys.dm_exec_sql_text(r.sql_handle) t
WHERE
    r.session_id = <session_id>; -- Replace with the session_id from the previous query
Step 2b — If the version store is large
The database likely has snapshot isolation enabled with long-running transactions preventing cleanup.
Check which databases have snapshot isolation enabled:
SELECT
    name,
    is_read_committed_snapshot_on,
    snapshot_isolation_state
FROM sys.databases;
If is_read_committed_snapshot_on or snapshot_isolation_state is 1, snapshot isolation is active.
Find sessions with long-running uncommitted transactions that are blocking version store cleanup:
SELECT * FROM sys.dm_tran_active_snapshot_database_transactions ORDER BY elapsed_time_seconds DESC;Use the session_id to check what the session is doing:
SELECT * FROM sys.sysprocesses WHERE spid = <session_id>;If the session status is sleeping, check the last executed statement:
DBCC INPUTBUFFER(<session_id>);Scenario 2: Investigating past tempdb growth after a restart
If the instance has already been restarted and live data is unavailable, use Average Active Sessions (AAS), slow query logs, and audit logs to reconstruct what happened.
Step 1 — Find the growth window
On the instance details page, go to Monitoring and Alerts > Standard Monitoring. In the Instance Storage section, note when the tmp_size metric started and stopped rising. Keep in mind that tempdb may reuse existing free space first — actual file expansion happens only after existing space is exhausted, so the growth in the chart may lag behind the start of the SQL operation.
Step 2 — Analyze using AAS
Go to Autonomy Services > Performance Optimization > Performance Insight. Select the time window, extending the start time earlier to capture all related operations. Look for SQL statements that heavily use disk-based temporary tables (for example, frequent creation of # tables).
Step 3 — Filter slow query logs by keyword
Go to Autonomy Services > Slow Query Logs. Search by keyword (for example, a temporary table name). Check query start times and durations to see whether the query end time aligns with when tempdb stopped growing.
Reclaim tempdb log file space
tempdb log files grow when a long-running transaction prevents log truncation.
Check
log_reuse_wait_descinsys.databases:SELECT name AS [DatabaseName], recovery_model_desc AS [RecoveryModel], log_reuse_wait_desc AS [LogReuseWaitDescription] FROM sys.databases;If
LogReuseWaitDescriptionisNOTHING, shrink the log file directly withSHRINKFILE. If it showsACTIVE_TRANSACTION, end the active long-running transaction first.Find the longest-running transaction in
tempdb:USE tempdb; GO DBCC OPENTRAN; GONote the session ID (SPID) and transaction start time.
Check what the session is doing:
SELECT * FROM sys.sysprocesses WHERE spid = <spid>;If the session status is
sleeping, check its last executed statement:DBCC INPUTBUFFER(<session_id>);
After ending the blocking transaction, shrink the tempdb log file:
USE tempdb;
DBCC SHRINKFILE(templog, 1);
GO
Reclaim other file space
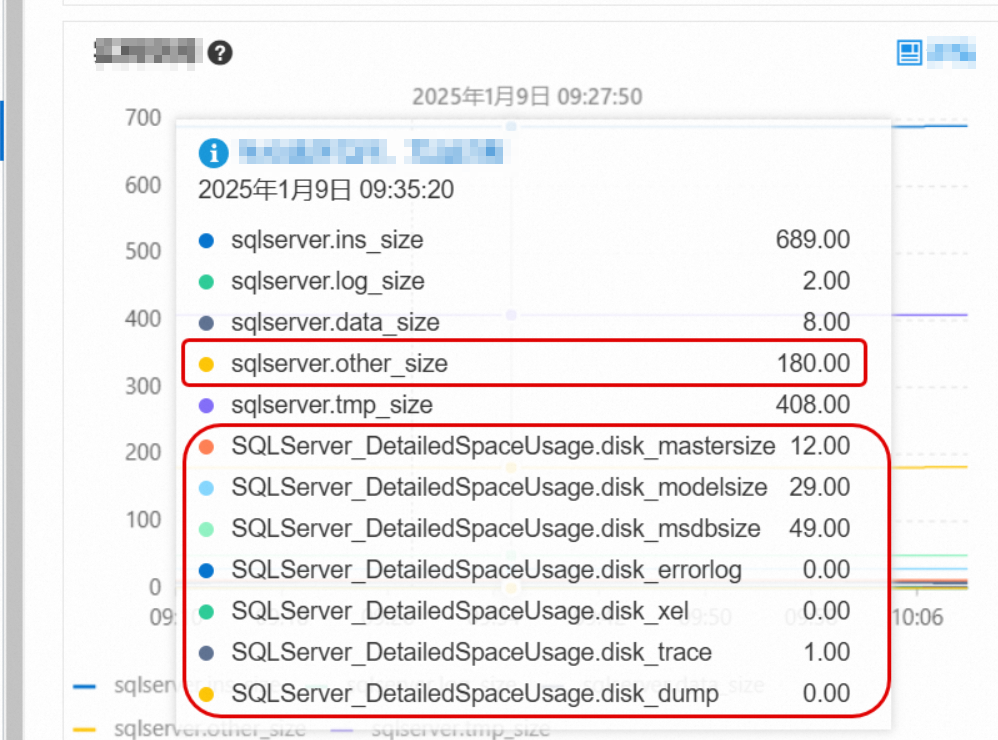
What other file space includes
Other file space covers system database files: sqlserver.other_size, mastersize, modelsize, and msdbsize. These are usually small, but can grow unexpectedly in two scenarios:
Error logs: The
errorlogfile can grow to several gigabytes or more if the instance generates many error events.Memory dump files: SQL Server automatically generates memory dumps during critical exceptions.
Identify and clear oversized files
Go to Monitoring and Alerts > Standard Monitoring and check the space used by these file types. For metric definitions, see View standard monitoring.
If
errorlogis consuming a large amount of space, go to the Logs page to clear the error logs. For instructions, see Manage logs.
If other system files (such as sqlserver.other_size) are unexpectedly large, contact technical support to identify the root cause.Scale out storage space
If space usage remains high after applying the steps above, scale out the instance's storage capacity. For instructions, see Change instance specifications. The new storage takes effect immediately without an instance restart.