The storage management feature of Database Autonomy Service (DAS) provides hierarchical monitoring and analysis, allowing you to drill down from the instance level to databases and tables. You can view basic instance information, a storage overview, storage data charts, and storage trends to help you identify and troubleshoot storage-related issues and anomalies.
Prerequisites
-
This feature is not available for ApsaraDB RDS for SQL Server 2008 R2 instances that use cloud disks.
-
This feature is available only for ApsaraDB RDS for SQL Server instances in the following regions: China (Hangzhou), China (Shanghai), China (Qingdao), China (Beijing), China (Zhangjiakou), China (Hohhot), China (Ulanqab), China (Shenzhen), China (Heyuan), China (Guangzhou), China (Chengdu), China (Hong Kong), Singapore, or UAE (Dubai).
View storage metrics
-
Go to the Instances page, select the region where your instance is located, and then click the ID of the target instance.
-
In the navigation pane on the left, choose . You can view the following information:
-
Storage overview
This section provides a high-level view of your storage, including changes in the last week, available storage, used storage, and estimated growth. The following table describes the parameters.
Table 1. Storage overview parameters
Parameter
Description
Changes in the Last Week
The net change in storage usage for the RDS instance over the last week and the average daily growth.
Note-
Average daily growth is the average growth per day since the instance was created.
-
A negative value indicates a decrease in storage usage.
Available Space
The amount of available storage for the RDS instance and the estimated number of days it will last.
Used Storage
The amount of used storage for the RDS instance and the number of days it has been in use.
Expected Growth
The estimated number of days until the storage usage of the RDS instance reaches 80% and 100%, based on current usage patterns.
Data Updated At
The time when the data on the Storage Management page was generated.
Recollect
If the Data Updated At time seems outdated, you can click Recollect and confirm to trigger an asynchronous data recollection in the background.
NoteData is recollected asynchronously. Wait a few minutes and refresh the page to view the results.
Save as PDF File
To save the page to your local device, click Save as PDF File and wait for the PDF file to be generated.
-
-
Storage data charts
This section visualizes the instance's storage, showing overall usage, the ratio of data to logs, and the top five databases by storage. The following table describes the parameters.
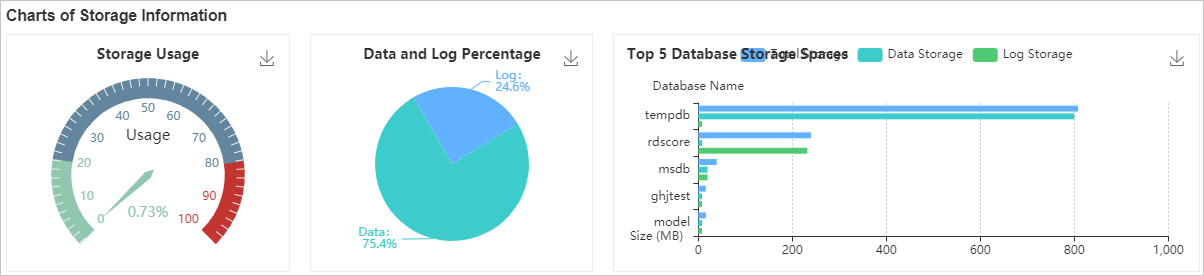
Table 2. Storage data chart parameters
Parameter
Description
Storage Usage
A gauge chart shows the current storage usage of your RDS instance. If storage usage exceeds 80%, consider upgrading the instance storage or clearing data.
Data and Log Percentage
A pie chart shows the ratio of data space to log space for your RDS instance. If log space accounts for a high percentage, you may need to shrink the logs in the console or enable the 30-minute log backup feature.
Top 5 Database Storage Spaces
A horizontal bar chart shows details of the top five databases by storage usage, including:
-
Total space (MB)
-
Data space (MB)
-
Log space (MB)
-
-
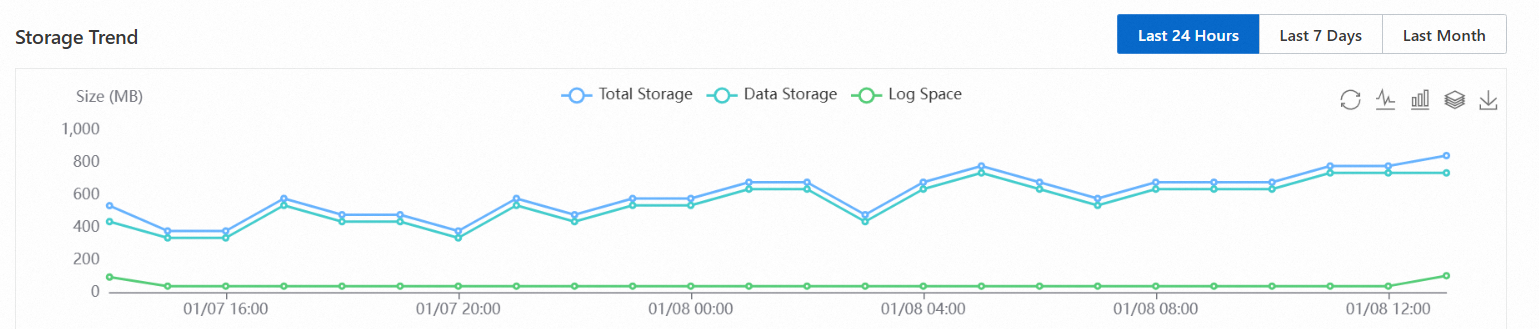
Storage trend
A line chart shows storage changes for the RDS instance. You can view charts for the last day, last week, or last month, including total space, data space, and log space.
-
Top 10 databases
A table displays detailed information about the top 10 databases by storage usage. The following table describes the parameters.
Table 3. Top 10 databases parameters
Parameter
Description
Database Name
The name of the database in the instance.
Status
The status of the database.
Total Size (MB)
The total space occupied by a single database in the instance, in MB.
Used Storage (MB)
The used space of a single database in the instance (in MB) and its percentage of the total.
Available Storage (MB)
The remaining available space of the database (in MB) and its percentage of the total.
Recovery Mode
The recovery model of the database.
NoteFor non-system databases, this is typically FULL.
Sorting Rule
The character set collation of the database.
Log Reuse Wait
The event preventing transaction log reuse.
Created At
The time when the database was created.
System Database
Indicates whether the database is a SQL Server system database.
Click the
 icon on the far left of a row to expand the database and view its file details. The following table describes the parameters.
Table 4. Top 10 database file parameters
Parameter
Description
Database Name
The name of the database.
File Group
The name of the file group to which the file belongs.
NoteLog files do not have a file group, so this field is empty.
File Type
The type of the file. Common types are Data and Log.
File Name
The name of the file in the database.
Total Storage (MB)
The total space of the file, in MB.
Used Storage (MB)
The used space of the file (in MB) and its percentage of the total.
Available Storage (MB)
The available space of the file (in MB) and its percentage of the total.
Maximum File Size
The maximum size limit of the database file, in MB.
NoteA value of 0 indicates that there is no limit.
Automatic File Growth
The amount by which the file automatically grows, specified as a percentage or a fixed value.
-
Top 20 data tables
A table displays information about the top 20 data tables by storage usage. The following table describes the parameters.
Table 5. Top 20 data tables parameters
Parameter
Description
Table Name
Consists of three parts:
-
Database name
-
Schema name
-
Object name
Size (MB)
The total space occupied by the table, in MB.
Data Size (MB)
The space occupied by data in the table (in MB) and its percentage of the reserved size.
Index Size (MB)
The space occupied by indexes on the table (in MB) and its percentage of the reserved size.
Unused Storage (MB)
The unused space in the table (in MB) and its percentage of the reserved size.
Rows
The total number of records in the table.
Index Quantity
The number of indexes on the table.
Created At
The time when the table was created.
-
-