When your ApsaraDB RDS for PostgreSQL instance shows high load or performance jitter, the slow query log analysis feature in Database Autonomy Service (DAS) is typically the first place to investigate. With this feature, you can:
-
Identify which queries are running slowly and how their frequency changes over time
-
Drill into individual query samples to see full execution details
-
Get SQL optimization suggestions and expected performance improvements
-
Export slow query logs for offline analysis
Prerequisites
Before you begin, ensure that you have:
-
An RDS instance running RDS High-availability Edition
Analyze slow query logs
-
Go to the Instances page. In the top navigation bar, select the region where the instance resides. Find the instance and click its ID.
-
In the left-side navigation pane, choose Autonomy Services > Slow Query Logs.
-
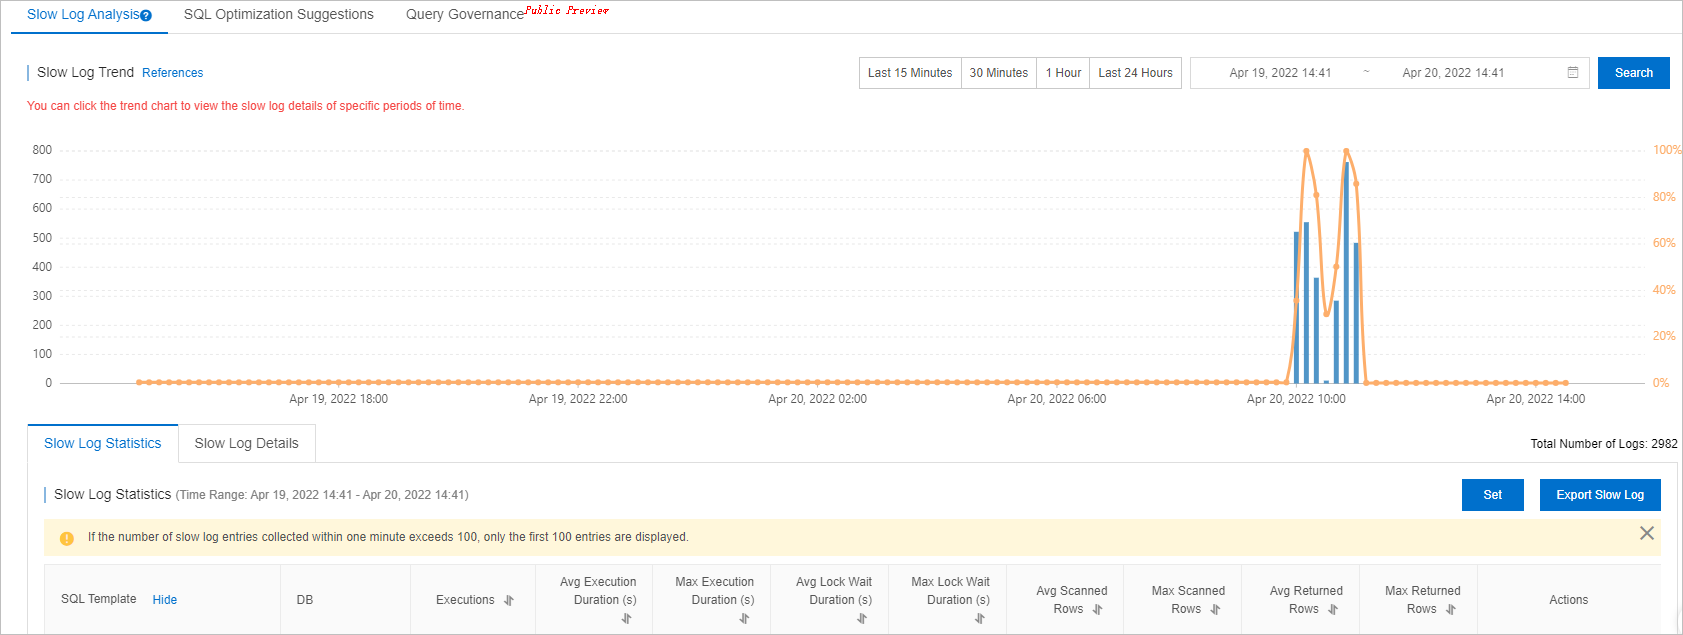
On the Slow Log Analysis tab, set a time range to view the trend chart, statistics, and details for slow queries within that period.
The end time must be later than the start time, and the interval cannot exceed 24 hours. You can query slow query logs from the past month.
On this tab, you can also:
-
Click a time point in the trend chart to view statistics and details for slow queries at that moment.
-
Click Export Slow Log to download the slow query logs.
-
-
On the Slow Log Statistics tab, view slow queries grouped by SQL template.
For each SQL template, you can:
-
Click Sample in the Actions column to open the Slow Log Sample dialog and view details of individual query executions.
-
Click Optimize in the Actions column to open the SQL Diagnostic Optimization dialog. DAS analyzes the query based on SQL complexity, table data volume, and database load. Optimization suggestions may take more than 20 seconds to appear.
After the analysis completes, DAS shows diagnostics results, optimization suggestions, and expected performance improvements. To apply the suggestions, click Copy in the upper-right corner, then paste the optimized SQL into your database client or Data Management (DMS) for execution. To discard the suggestions, click Cancel.
-
-
On the Slow Log Details tab, find a specific SQL template and click Optimize in the Actions column to run SQL diagnostic optimization.
What's next
Enable automatic SQL optimization so that DAS can diagnose and optimize slow queries without manual intervention. For more information, see Use the automatic SQL optimization feature for an ApsaraDB RDS for PostgreSQL instance.
If you need hands-on database assistance, click Database Expert Service on the Slow Query Logs page to purchase professional database services, including emergency solutions, health diagnostics, performance optimization, security assurance, and data migration.