Database Autonomy Service (DAS) automatically diagnoses slow SQL queries and manages indexes for ApsaraDB RDS for PostgreSQL instances to maintain optimal performance. With automatic SQL optimization, DAS can:
Run daily diagnostics on SQL statements and identify slow queries
Recommend indexes to address performance bottlenecks
Automatically create or delete indexes based on recommendations (if enabled)
Prerequisites
Before you begin, ensure that you have:
An RDS instance running RDS High-availability Edition
The SQL Explorer and Audit feature enabled on the instance. For more information, see Use the SQL Explorer and Audit feature.
SQL Explorer and Audit allows DAS to distinguish slow SQL from normal SQL queries. Without it, automatic SQL optimization may also optimize normal queries and degrade overall instance performance.
Enable automatic SQL optimization
Go to the Instances page. In the top navigation bar, select the region where the instance resides, then click the instance ID.
Open the Autonomous Function Management panel using one of the following methods:
In the left-side navigation pane, choose Autonomy Services > Diagnostics. On the page that appears, click the Autonomy Center tab. In the upper-right corner, click Autonomy Service Settings.
In the left-side navigation pane, choose Autonomy Services > Dashboard. On the Performance Trends tab, click Autonomy Service Settings.
On the Autonomous Function Settings tab, turn on the autonomy service switch. On the Optimization and Throttling tab, select Automatic Index Creation and Deletion and choose a mode.
When automatic index creation is enabled, DAS creates indexes within the maintenance window configured for the instance.
Mode What DAS does SQL Diagnostics Only Runs daily SQL diagnostics and provides index recommendations. Does not create indexes on the instance. SQL Diagnostics and Automatic Index Creation Runs daily SQL diagnostics, provides index recommendations, and automatically creates indexes on the instance. 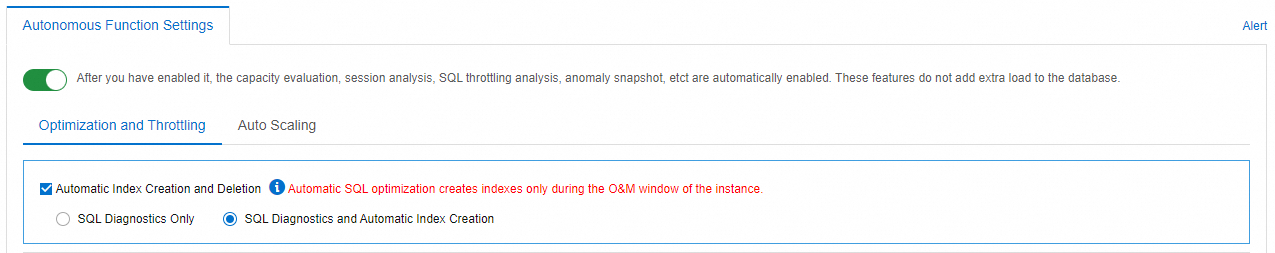
Click OK.
(Optional) In the Alert Configuration section, configure an alert template and subscribe to alert notifications to track the status of automatic SQL optimization tasks. The system recommends an alert template and automatically adds alert rules for the required autonomy events. Follow the on-screen prompts to complete the configuration.
- If an alert template is already configured for the instance, add alert rules for the required autonomy events to the existing template as prompted. - To configure a new alert template, see Configure alert templates and Configure alert rules.
In the Select Alert Contact Group step, select an alert contact group. For more information, see Manage alert contacts.
Click Add Contact to add an alert contact.
Click Create Contact Group to create an alert contact group.
To modify or delete an existing contact, find the contact and click Edit or Remove in the Actions column.
In the Associate with Resources step, confirm the associated resources.
Click Submit Configuration and confirm the configuration in the dialog box.
What's next
After enabling automatic SQL optimization, view optimization events in the Autonomy Center:
Select a time range to list optimization events.
Find the event and click Details in the Actions column.
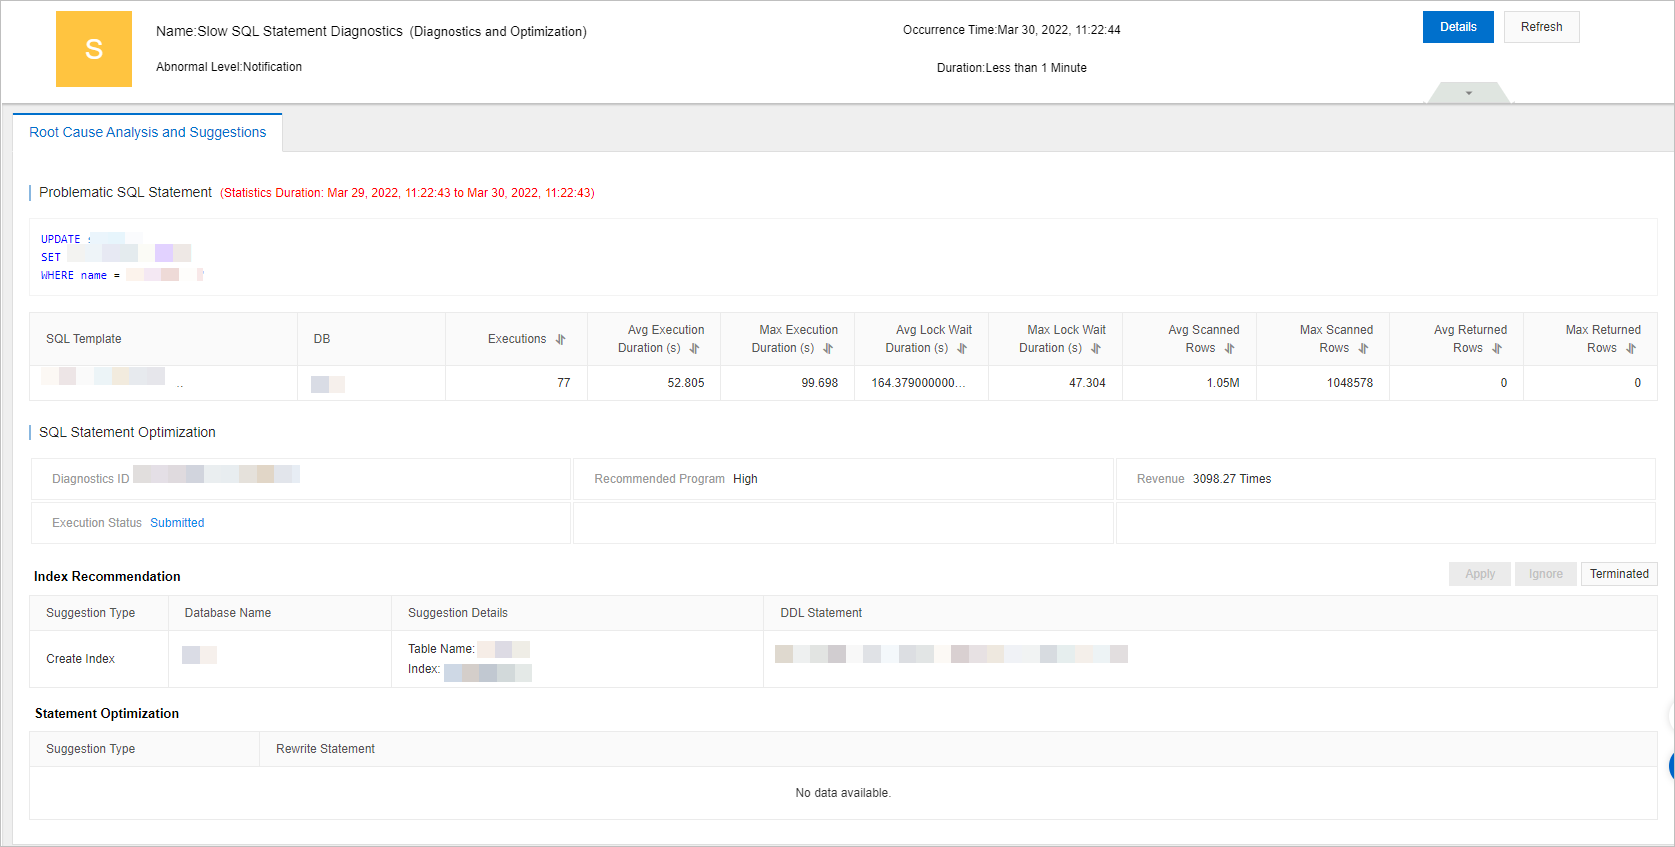
On the Root Cause Analysis and Suggestions tab of the Slow SQL Statements Diagnostics (Diagnostics and Optimization) event, review the following sections:
Problematic SQL Statements — slow queries identified by DAS
SQL Statement Optimization — suggested rewrites or execution plan changes
Index Recommendation — indexes DAS recommends creating
Statement Optimization — further statement-level improvements