User Insights helps you analyze user profiles through tagging, segmentation, and cross-dimensional distribution to better understand your audience.
This document is an introduction to Quick Tracking and technical integration and is not used as a sales basis. For specific products and technical services purchased by an enterprise, the commercial purchase contract shall prevail.
User Insights mainly consists of four parts: user overview, report management, insight analysis, and individual drill-down.
By leveraging tags, User Insights provides multi-dimensional analysis for all users and segmented users, helping business teams gain a comprehensive understanding of their audience.
User overview
Overview
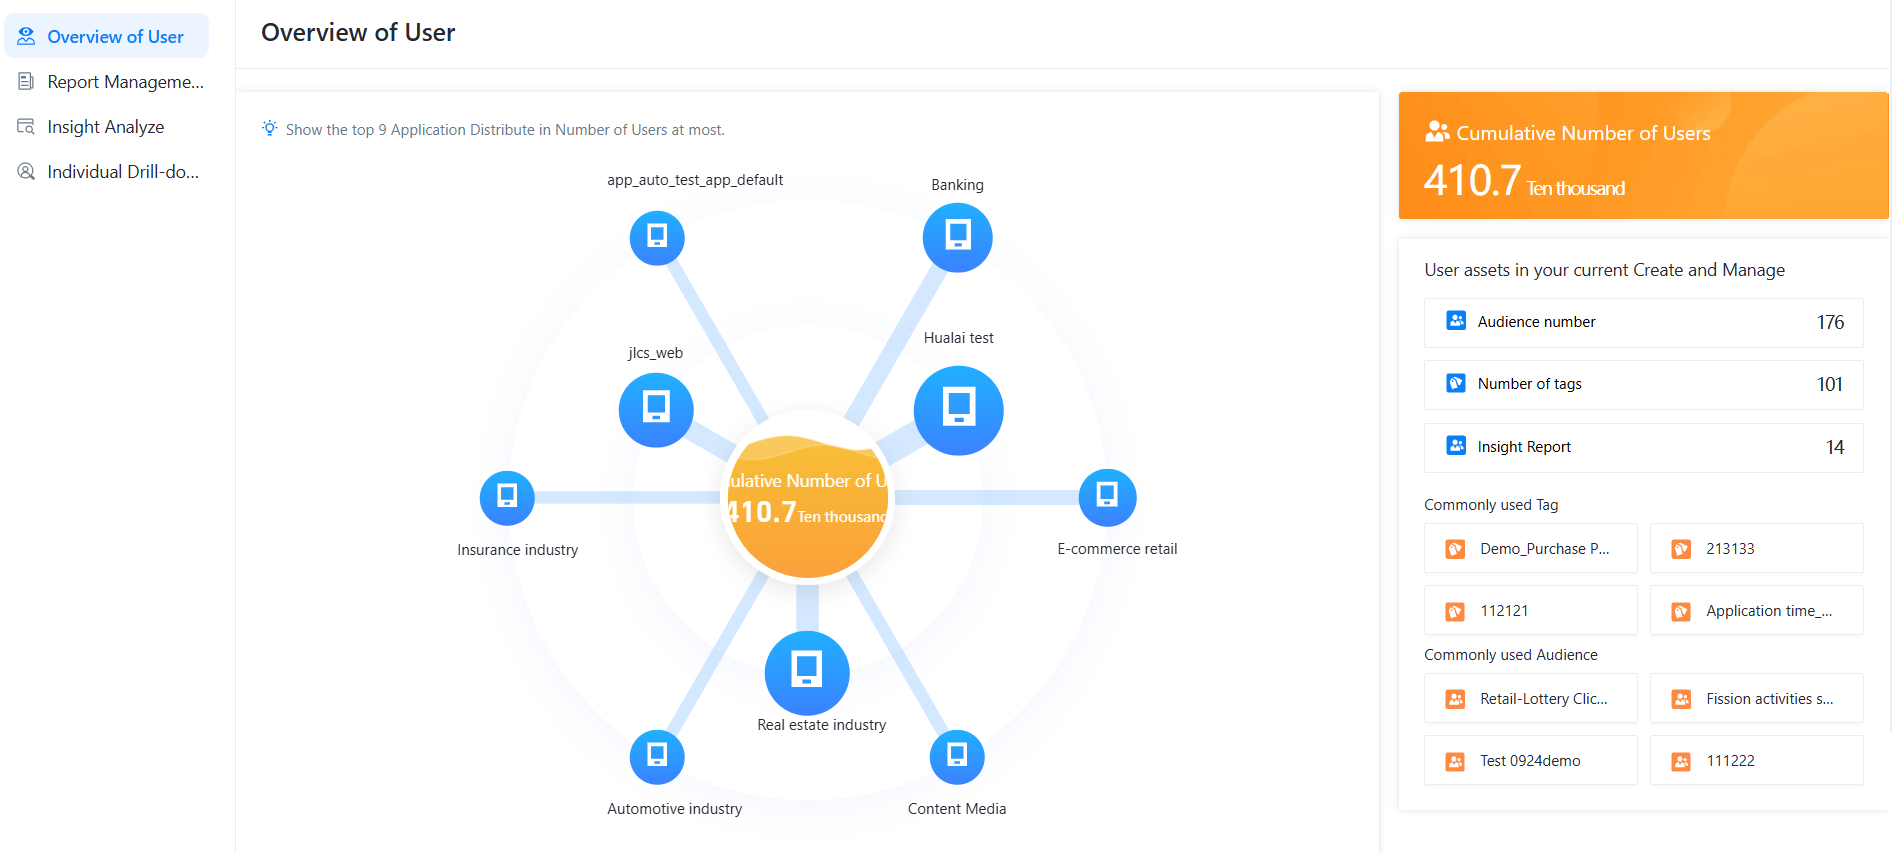
View the overall feature distribution of all private domain users and identify salient characteristics.
Operations
1. View user overview
1) In the [User Overview] section, view cumulative user asset access and the distribution across applications. Common tags and groups are listed on the right. Click a tag or group to drill down.
Report management
Overview
Lists all saved user insight reports with the report name, insight audience, creation time, and modification time. You can create, enter, or delete a report, and filter by report name or group name.
Operation instructions:
1. View the insight report
1) In the [Report Management] section, view the saved insight reports. Click [Enter] to open a report.
2. Delete an insight report
1) In the [Report Management] section, view the saved insight reports. Click [Delete] to remove a report.
Insight analysis
Overview
Provides a visualization template. Select an audience and combine tags to view the distribution of the selected audience across each tag dimension.
Characteristic distribution analysis
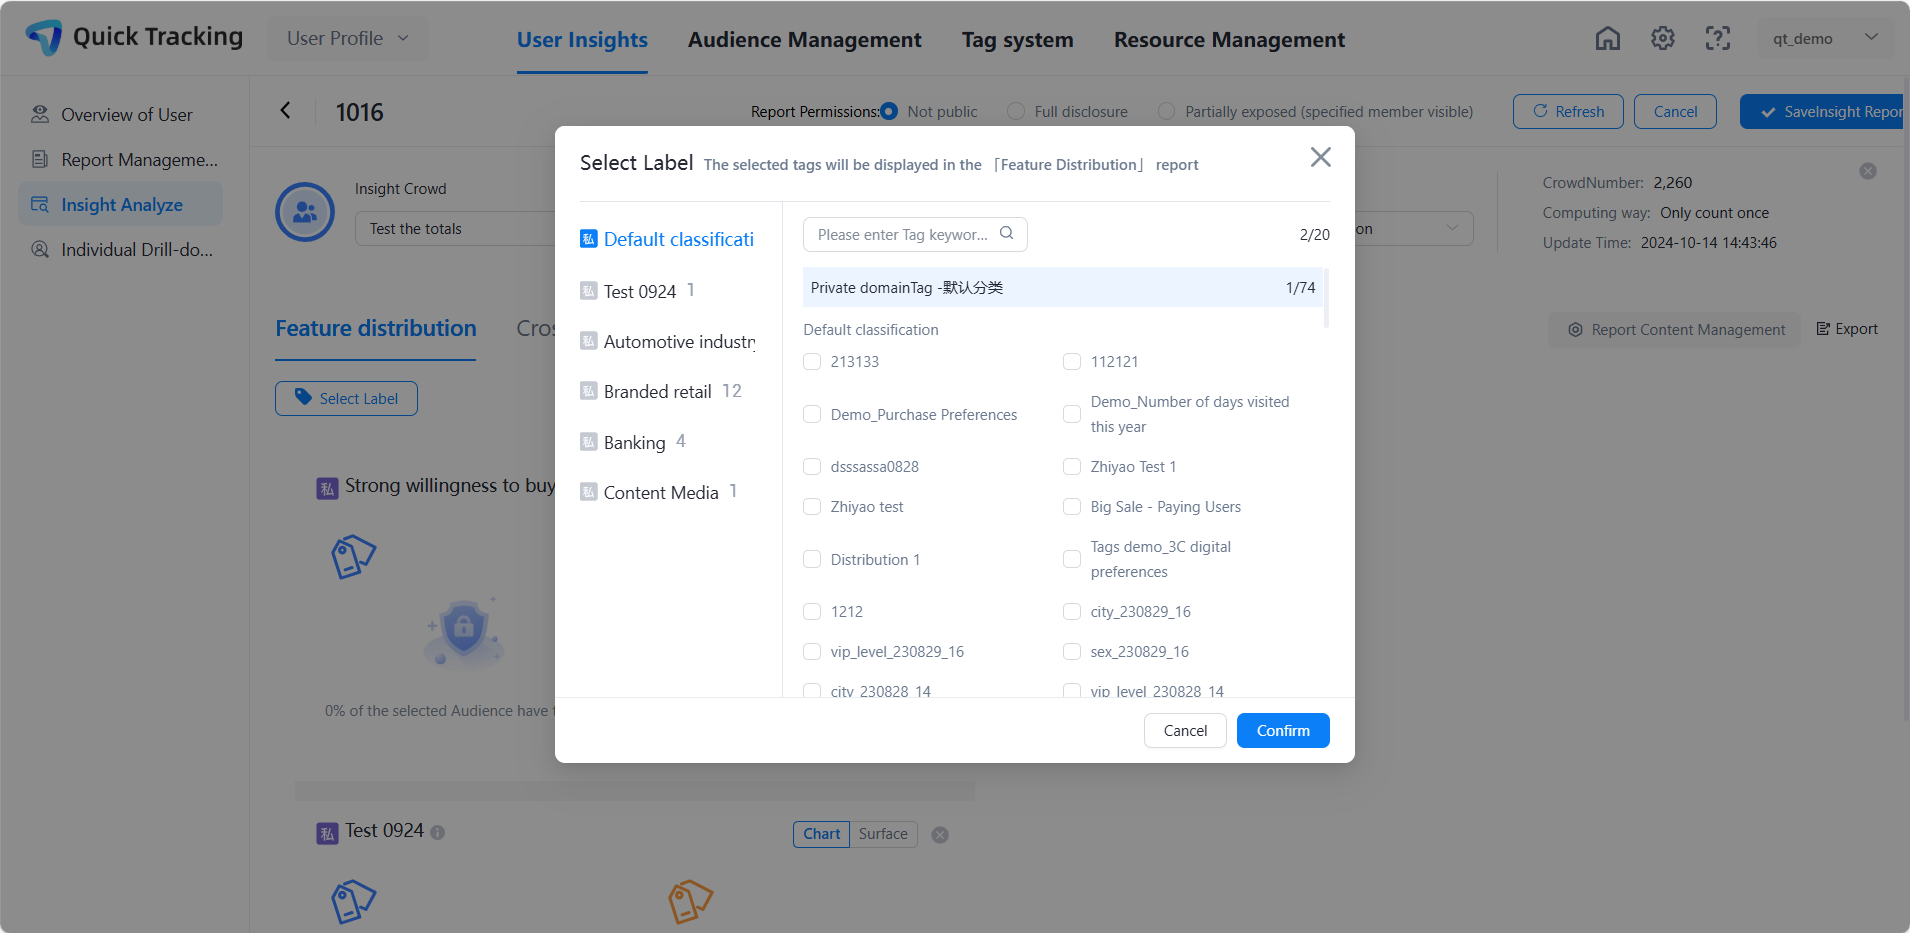
1) Click [Audience Feature Distribution] to enter the analysis module.
2) Select [Audience], configure [Tag], and click OK to submit the background computing task.
3) For large datasets, the calculation may take some time. Click [Refresh] at the top to check the latest results.
4) Click [+ Contrast Audience] to add a contrast audience and compare the profile distribution of both audiences side by side. Click to remove the comparison audience.
5) To remove a tag that is no longer needed, click to delete it.
6) Click [Save as Insight Report] in the upper right corner to save the current insight result. The saved report is added to the [Report Management] list.
Feature crossover analysis
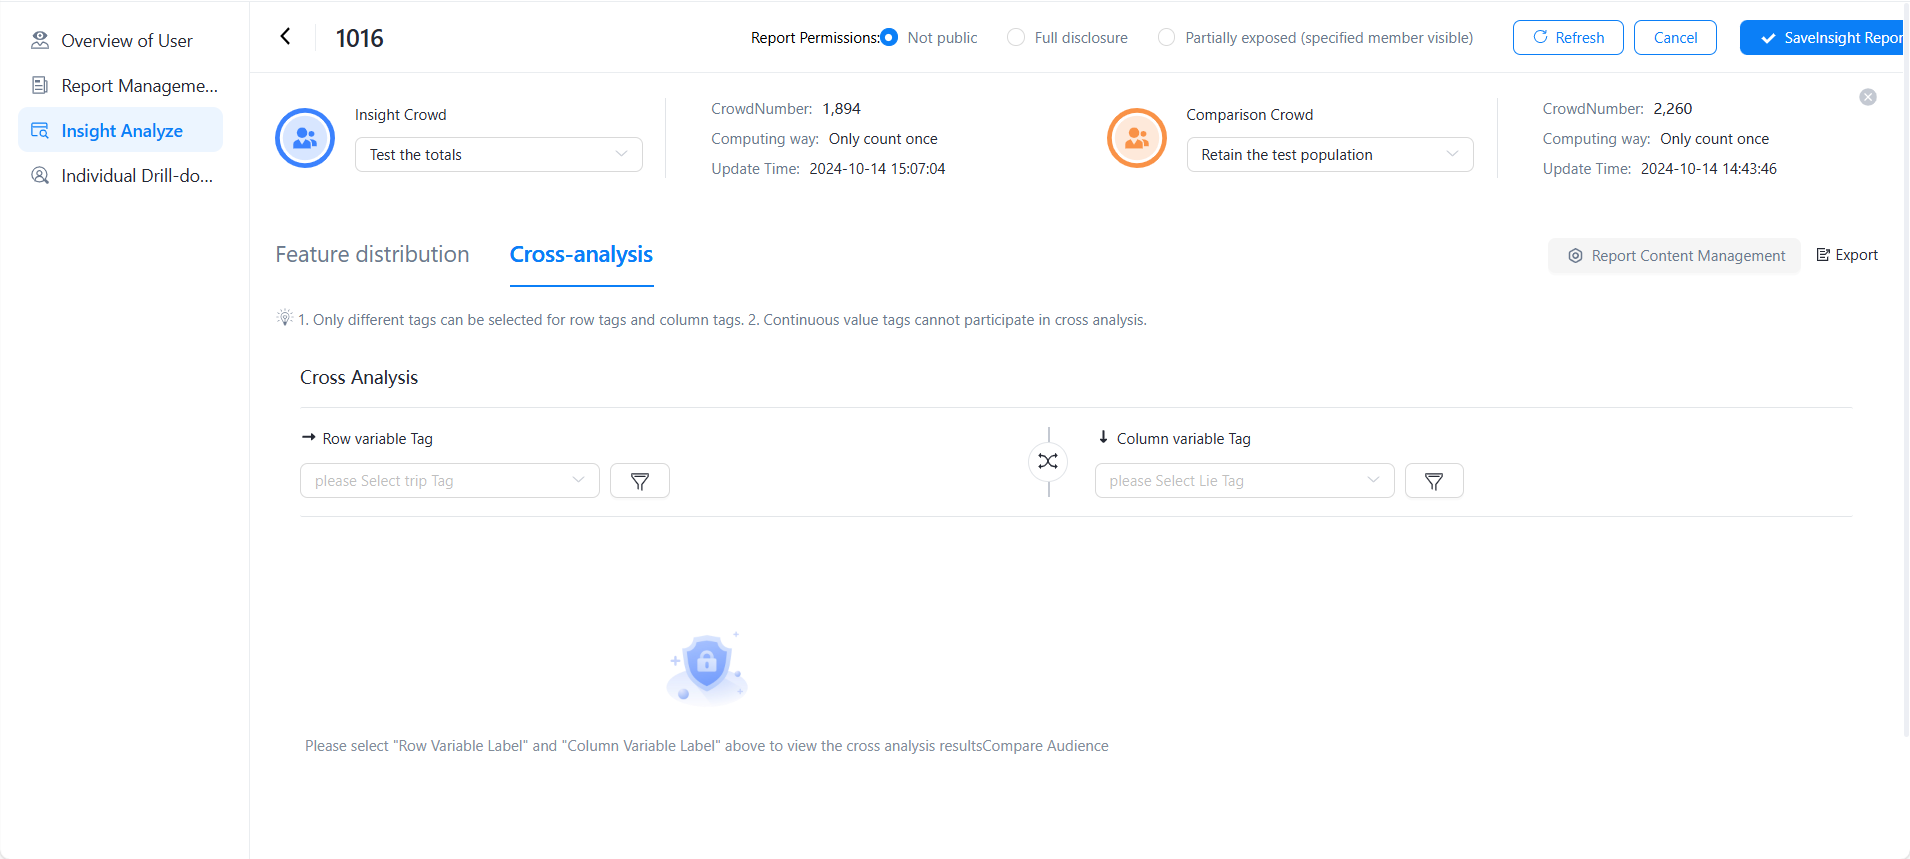
1) Click [Cross Analysis of Audience Characteristics] to enter the analysis module.
2) Select [Audience], configure row variable labels and column scalar labels, and click OK to submit the background computing task.
3) For large datasets, the calculation may take some time. Click [Refresh] at the top to check the latest results.
4) Click [+ Contrast Audience] to add a contrast audience and compare the profile distribution of both audiences side by side. Click to remove the comparison audience.
5) Click [Save as Insight Report] in the upper right corner to save the current insight result. The saved report is added to the [Report Management] list.
Individual drill-down
For more information, see Individual Drill-down.