Validate collected event data, SDK integration status, debug logs, and network requests before releasing your Android application.
1. Feature description
The Android SDK integration check plugin lets you verify collected event (instrumentation) data before releasing your application. You can view the Statistical Analysis SDK integration status, monitor events in real time, review debug logs, and inspect network requests.
1.1 Import the SDK
1.1.1 Integration
To use the SDK integration check plugin, you must first fully integrate the Statistical Analysis SDK. Ensure that you use qt-px-common version 1.7+PX. P versions are not supported. For more information, see
In the `dependencies` section of the `build.gradle` file for your app, add the Statistical Analysis SDK library and other library dependencies:
dependencies {
    implementation fileTree(include the following:['*.jar'], dir:'libs')

    // QuickTracking Statistical Analysis SDK
    implementation 'com.lydaas.qtsdk:qt-px-common:1.7.1.PX'

    // The event list depends on Androidx recyclerview. Import a version as needed for your framework. The version is not limited.
    implementation "androidx.recyclerview:recyclerview:1.3.0"


    // In Debug mode
    implementation 'com.lydaas.qtsdk:qt-sdk-monitor:1.0.0'

    // In release mode, do not include the monitor in the production version of the application.
    implementation 'com.lydaas.qtsdk:qt-sdk-monitor:1.0.0_empty'
}
In development environments using Android Studio 3.1 or later, specifying the latest version dependency as "latest.integration" may cause library download timeouts. If this occurs, specify a version number.
The SDK integration check plugin includes extensive inter-process communication logic and resource files that can impact your application's performance and package size. Do not include this tool in your production APK.
1.1.2 Enable the check plugin
The SDK integration check plugin is disabled by default. To enable it, call QtConfigure.enableSDKMonitor(true) before the preInit method. The following code provides an example:
public class QTApplication extends Application {
    @Override
    public void onCreate() {
        super.onCreate();

        QtConfigure.setCustomDomain("xxxxxx", null); // Enter your own data receiving domain name.

        QtConfigure.setLogEnabled(true);

        // Enable the listener plugin response feature.
        QtConfigure.enableSDKMonitor(true);

        QtConfigure.preInit(this, "xxxxxx", "Channel");// Enter your own AppKey.
        QtTrackAgent.disableActivityPageCollection();

// ...
2. Floating button
After the integration is complete, start the application to access the following features.
2.1 Entry point
When the application starts, a floating button appears showing the total number of events from the current launch and the reporting completion percentage. The percentage equals the number of events reported to the server divided by the total number of collected events. Click the floating button to open the plugin.
2.1.1 Floating entry point configuration
By default, the floating button is visible after the app starts and snaps to the screen edge. You can drag it to reposition. To hide the floating button, use the following method:
Add a button to your app's Debug page or developer tools page to toggle the floating button. The setting persists locally.
import com.quick.qt.analytics.monitor.QTSdkMonitor;

// Enable the floating button. Call this method after initialization is complete.
QTSdkMonitor.setFloatingButtonVisible(false); // The parameter is a boolean. Set to true to enable or false to disable.
2.1.2 Manually displaying the panel
If the floating button is hidden, use the following method to show the check tool panel:
import com.quick.qt.analytics.monitor.QTSdkMonitor;

// Show the QTSdkMonitor visualization panel.
QTSdkMonitor.showPanel();

// Manually close the visualization panel.
QTSdkMonitor.closePanel();
2.1.3 Show the floating event list
The event list near the floating button is hidden by default and shows the names of the most recently collected events. Use the following method to display it. This method works only when the floating button is visible.
import com.quick.qt.analytics.monitor.QTSdkMonitor;

// Floating event list
QTSdkMonitor.setFloatingButtonEventVisible(true);// The parameter is a boolean. Set to true to enable or false to disable.
3. Panel section
3.1 Event list
The event list supports searching by keyword (with regex matching), event type, reporting status, and entry status. You can sort events by time in ascending or descending order, clear the current event list, manually pull metadata from Data Management, clear the input box with a single click, and search historical instrumentation data.
Each event entry shows the creation time, event type, and event status. Click an event to view its details in JSON format. Long-press an event to copy its content to the clipboard.
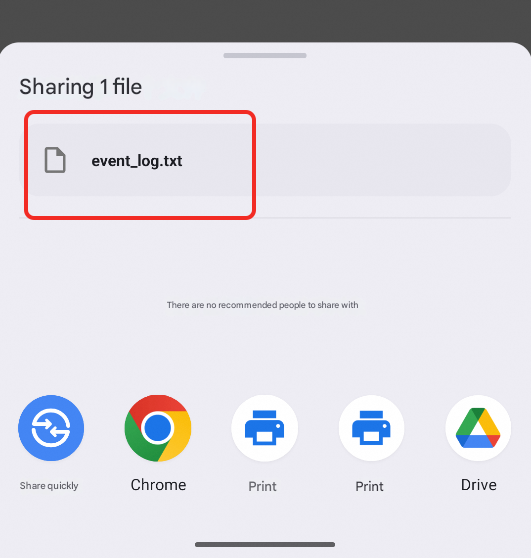
Events can also be packaged and shared as a log file.
3.1.1 Clear and share features
Clearing deletes all events in the current list. This action cannot be undone. Sharing packages the current event list into a TXT file for export and troubleshooting.
3.2 Console
The console is the main debugging panel for the SDK integration check plugin. It provides log display for the Statistical Analysis SDK, network packet capture, event statistics, and basic configuration.
3.3 Integration tab
View your current SDK version, AppKey, and feature usage status on this tab.
3.4 Debug log
Click "Debug Log" in the console panel to open the debug log page. Review error logs to troubleshoot integration issues.
Click a log entry to view its details.
3.5 Network packet capture
View the details of data being reported through network packet capture.
3.6 SDK configuration
View the current SDK settings:
3.7 Event statistics
View all current events grouped and counted.
3.8 SDKMonitor configuration
Configure settings for the SDK integration check plugin.