Ticker boards display a single metric to highlight key business data. You can quickly spot anomalies by monitoring how metrics change over time.
TensorBoard
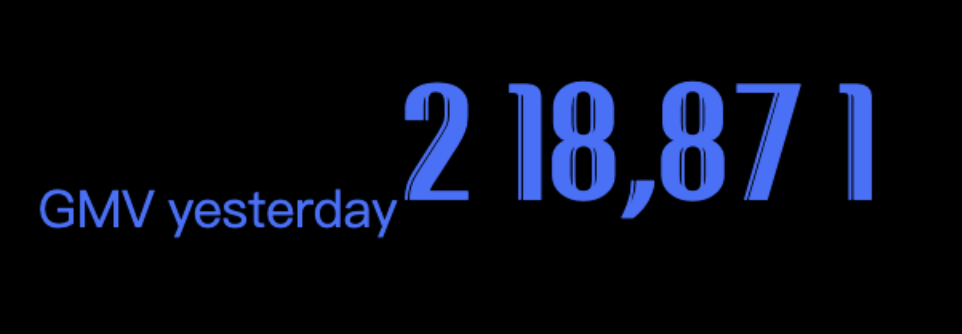
Add data
-
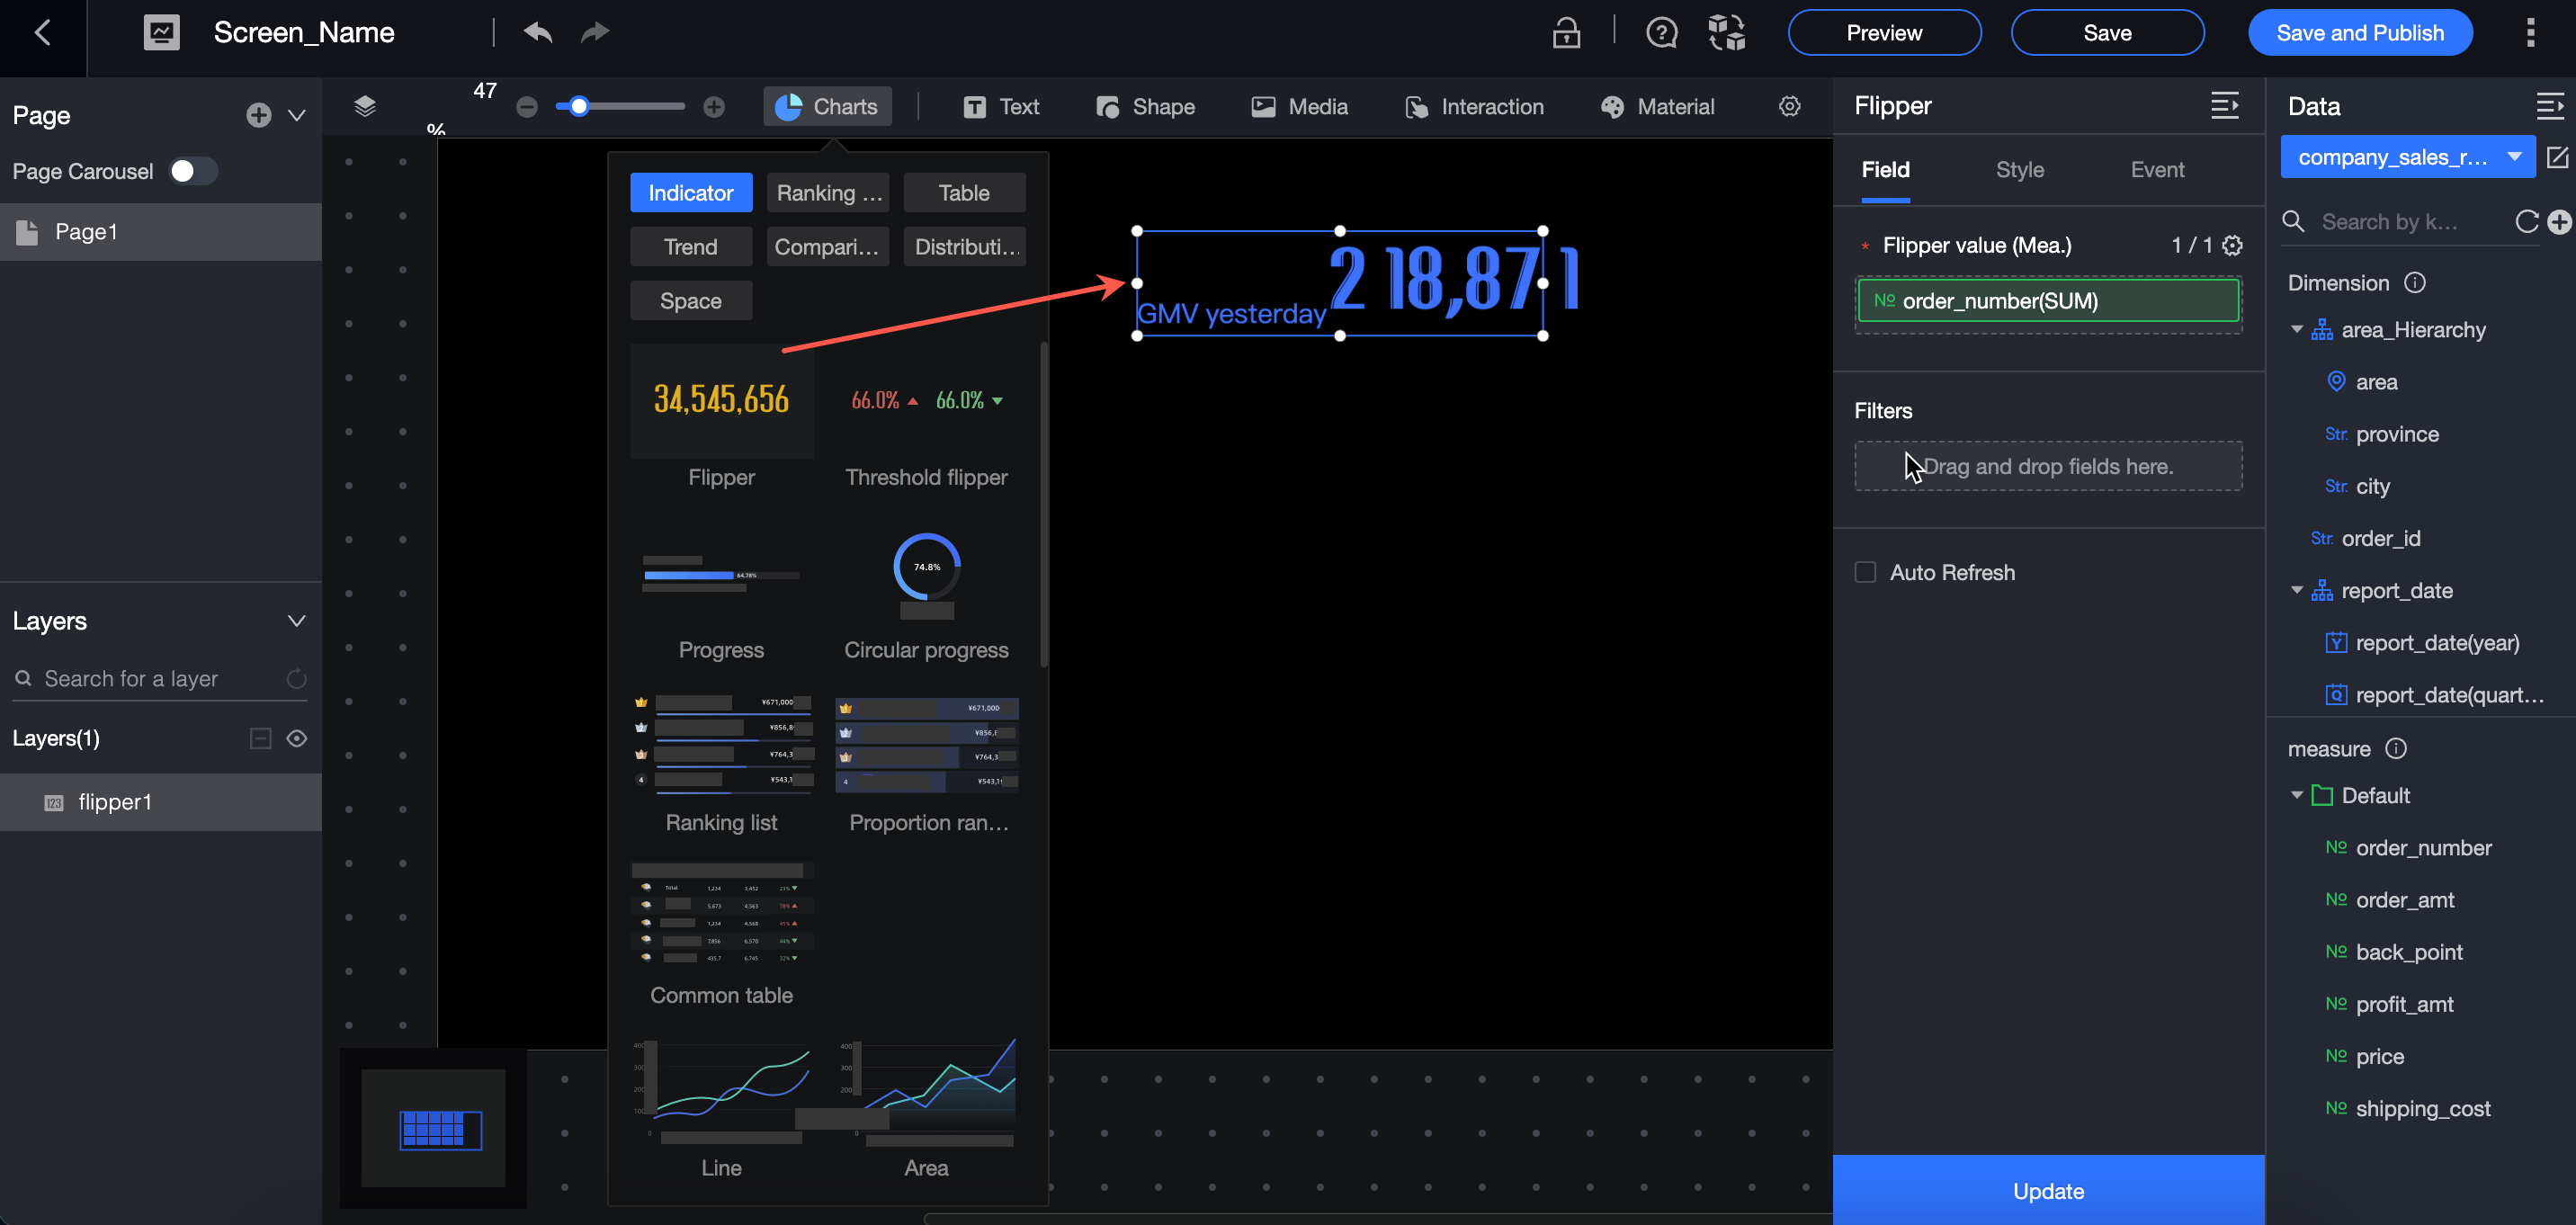
In the Chart section of the Widget Library section, find the ticker board and drag it to the canvas.
-
Click Select Dataset and follow the instructions in the following figure to add data.
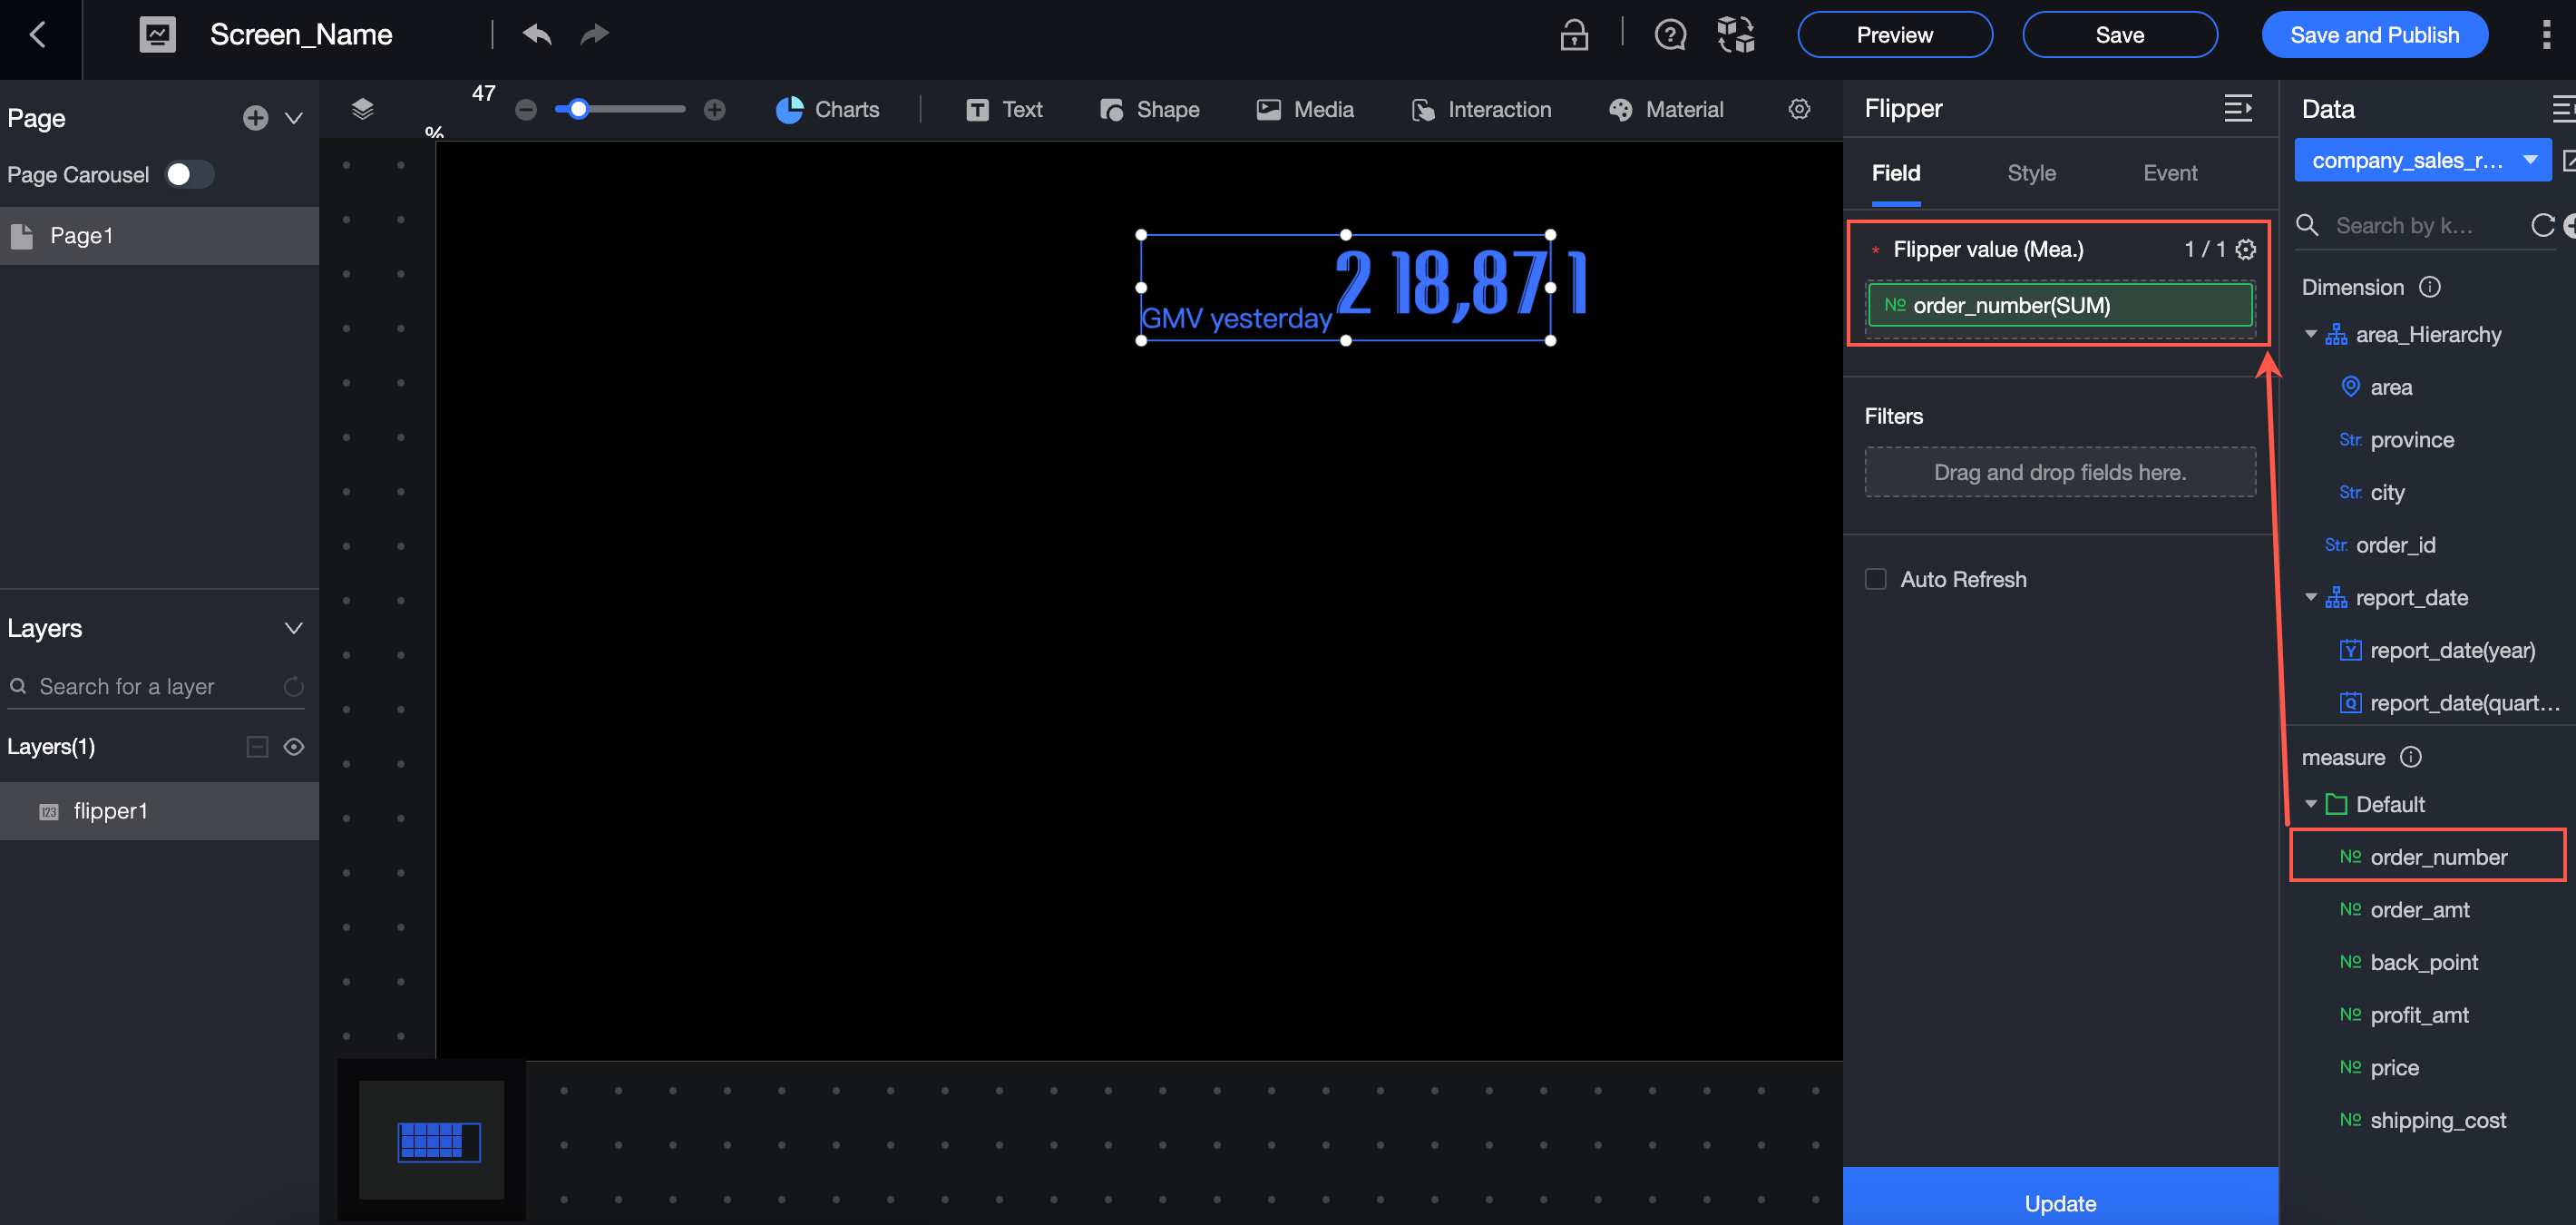
The following operations are also available: 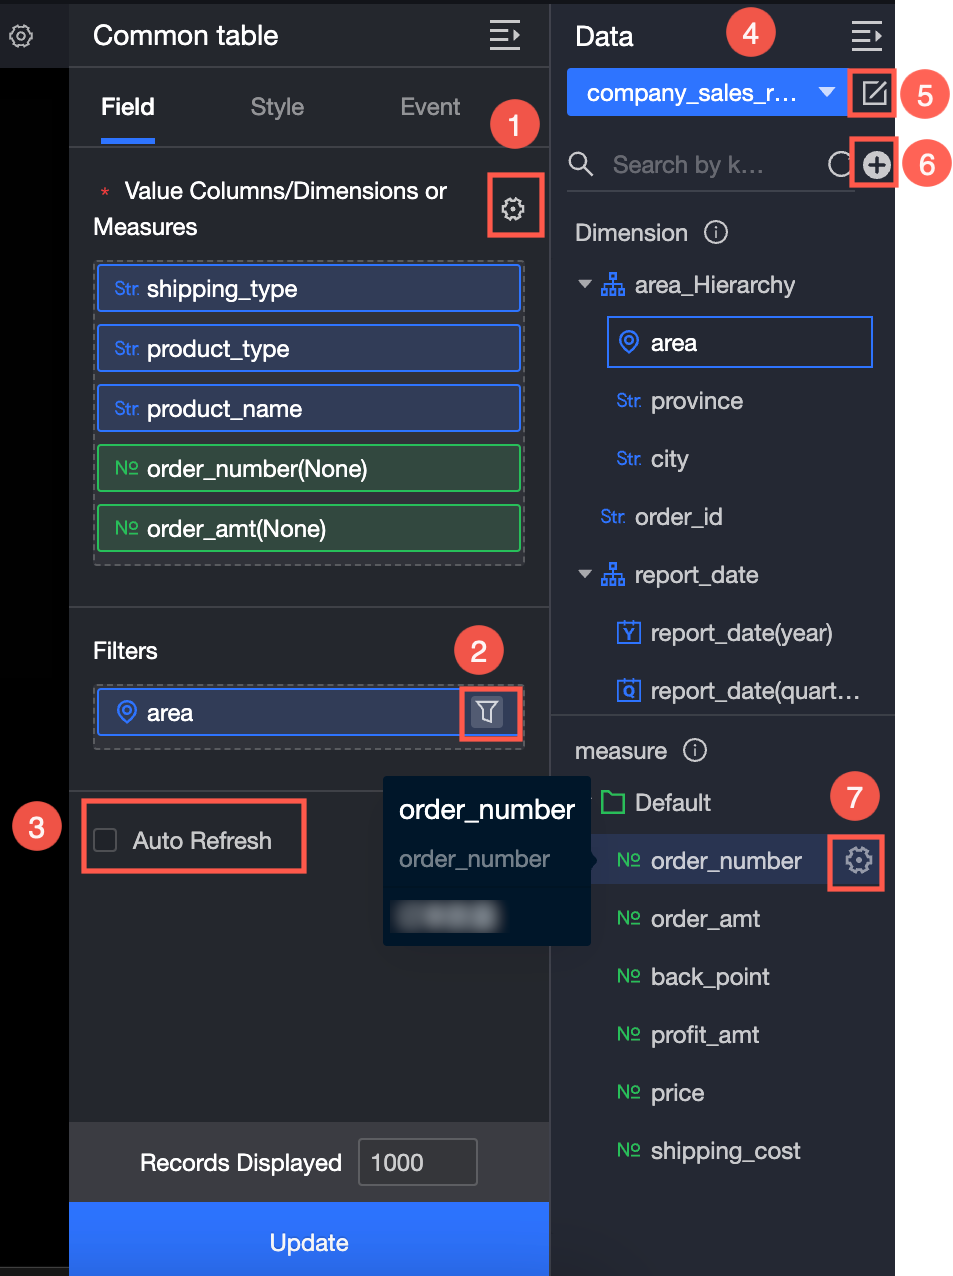
-
Configure multiple field formats. For more information, see Configure multiple field formats.
-
Configure field filtering. For more information, see Filter data.
-
Configure automatic data refresh (③). For more information, see Scheduled data refresh.
-
Switch a dataset. For more information, see Switch a dataset.
-
Edit a dataset. For more information, see Edit a dataset.
-
Data processing (⑥). For more information, see Create Calculated Field and Create Grouping Dimension.
-
Copy fields. For more information, see Copy to Dimension.
Configure Style
Location and size
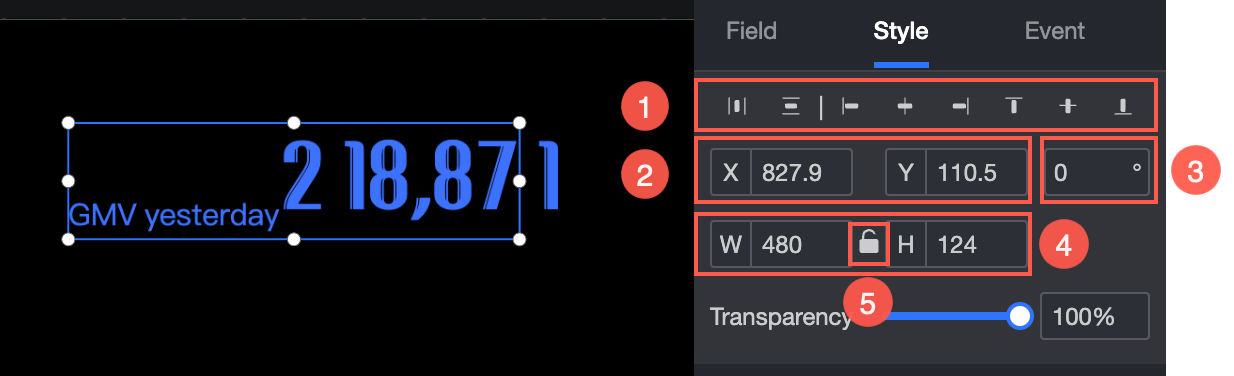
Configure the position and size of the widget:
-
Adjust widget alignment (①): Supports left, center, and right alignment.
-
Adjust the position of the widget (②): Set the X and Y values relative to the upper-left corner.
-
Adjust the rotation angle of the widget (③): Set the rotation value.
-
Adjust the size of the widget (④): Set the W and H values to change the width and height.
-
Lock the widget (⑤): Prevents the widget from being resized.
Metric
The Metrics section provides the following settings:
-
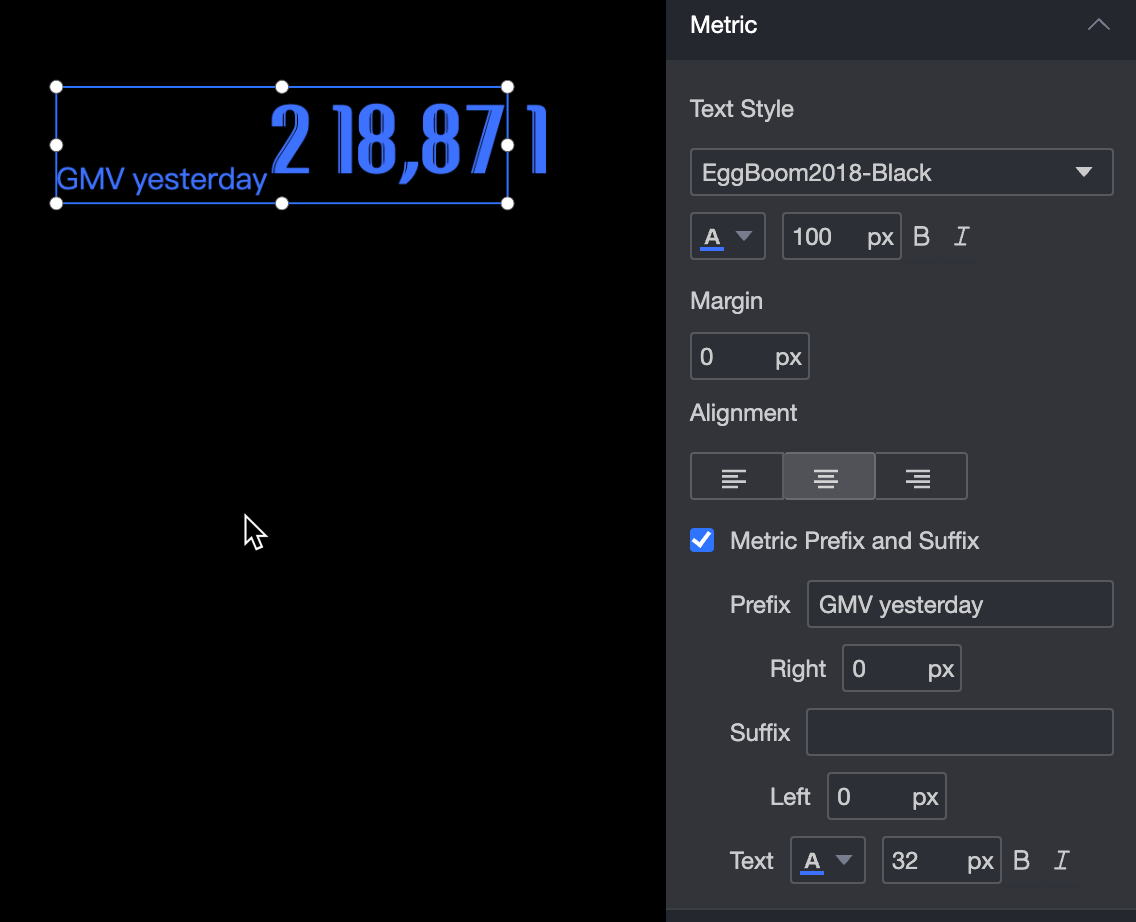
Text Style: Specify the font type, font color, font size, text spacing, and text alignment (left-aligned, center-aligned, and right-aligned).
-
Indicator Prefix and Suffix: Specify the prefix, right margin, suffix, left margin, color, and size of the prefix and suffix.
Animation effect
The Animation section provides the following settings:
-
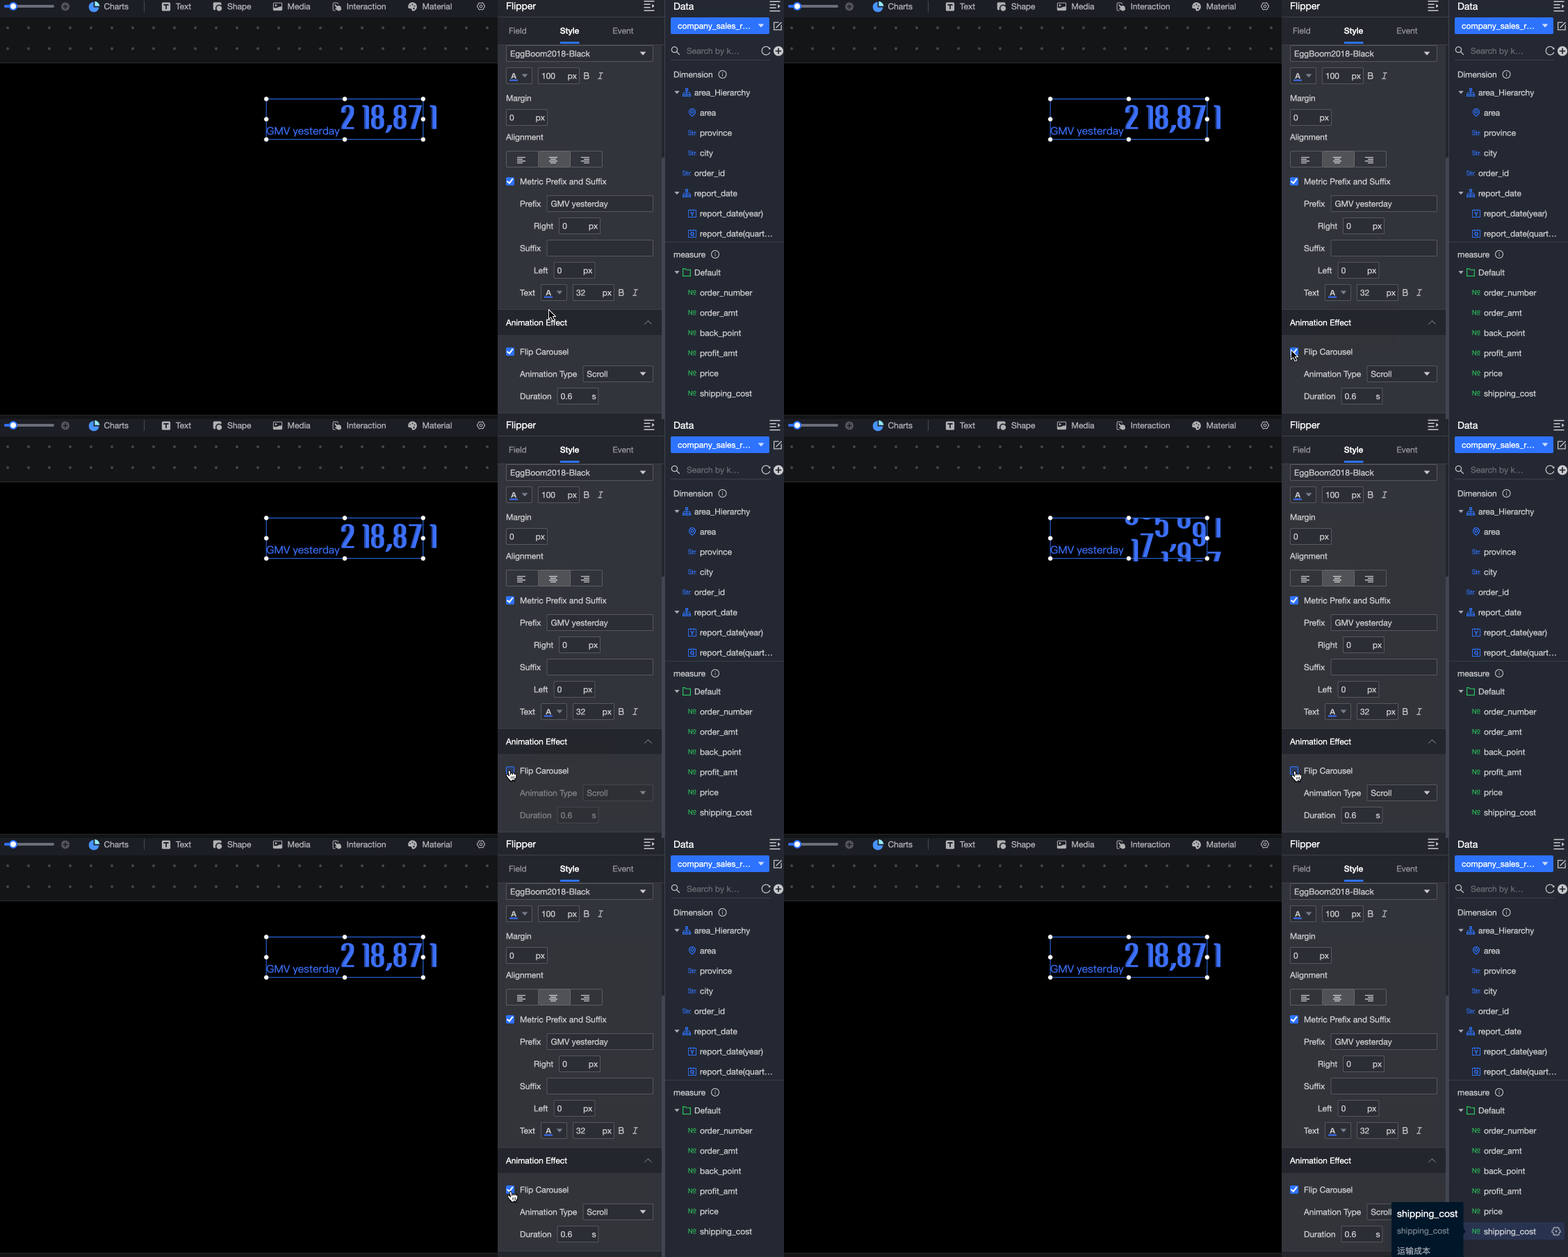
Animation Type: Select an animation type, such as scroll or flip.
-
Transition Duration: Specify how long the animation transition lasts.
Conditional Formatting
The Conditional Formatting section provides the following settings:
-
Select Series: Select any measure added to the Indicators section.
-
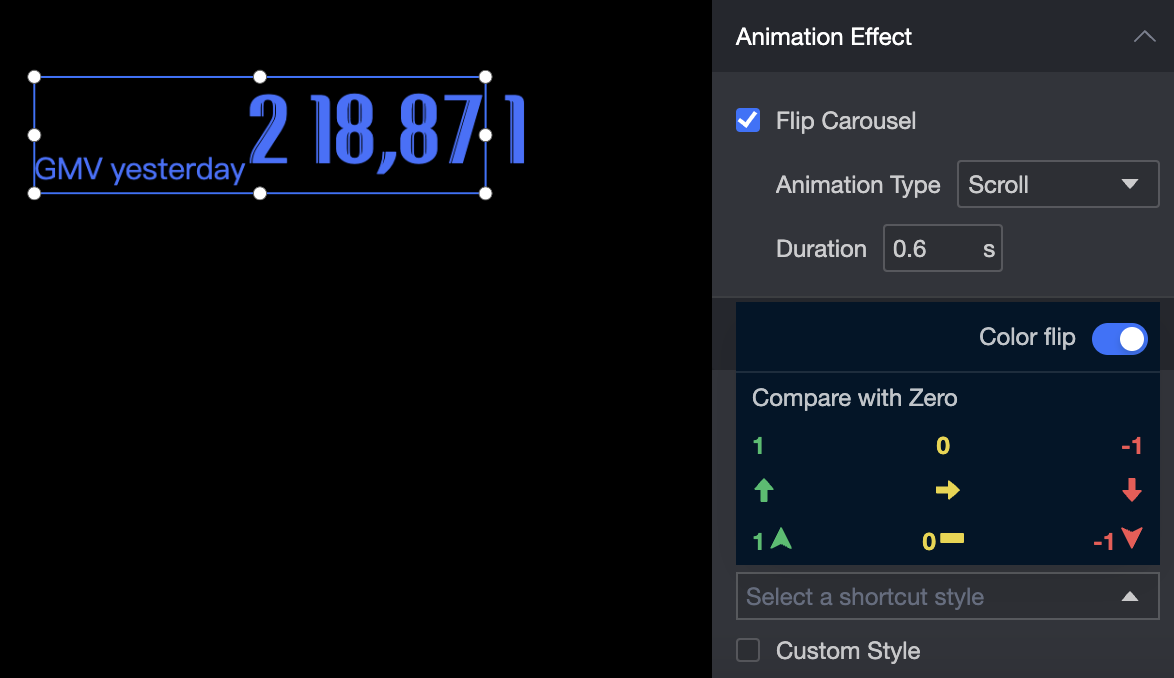
Shortcut Style: Specify the color of the marker icon and font.
-
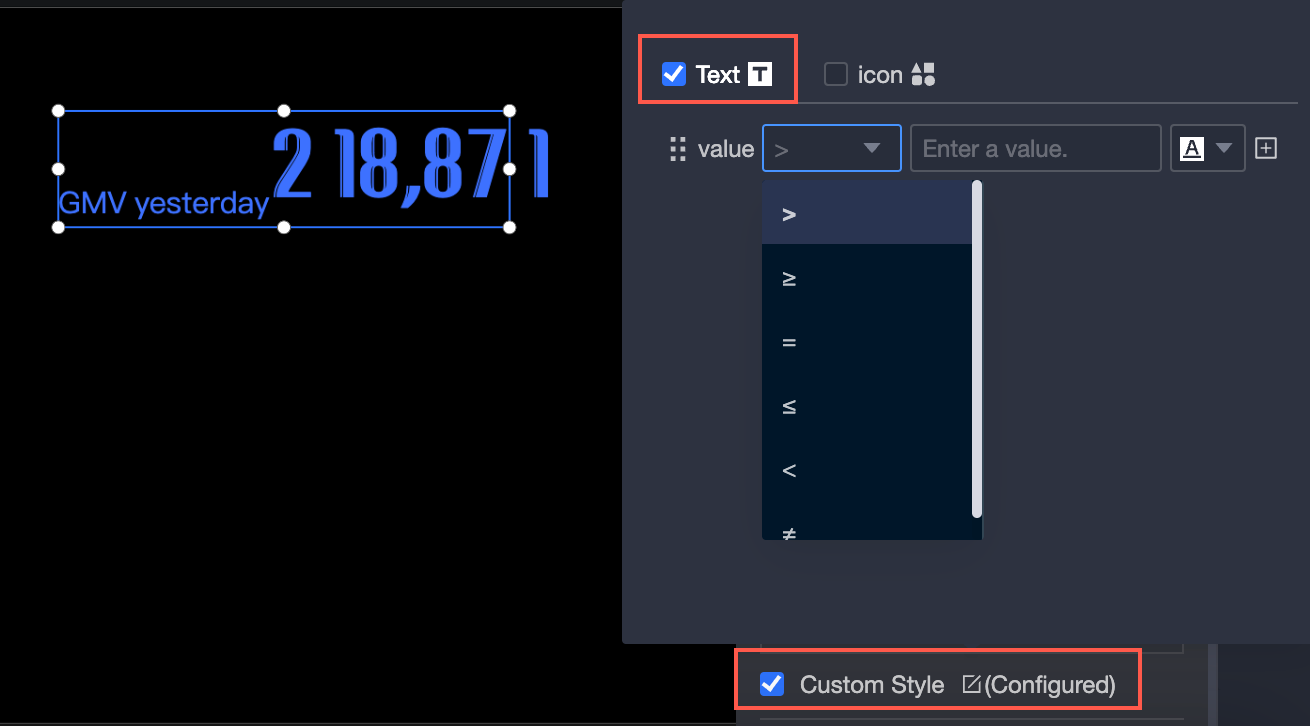
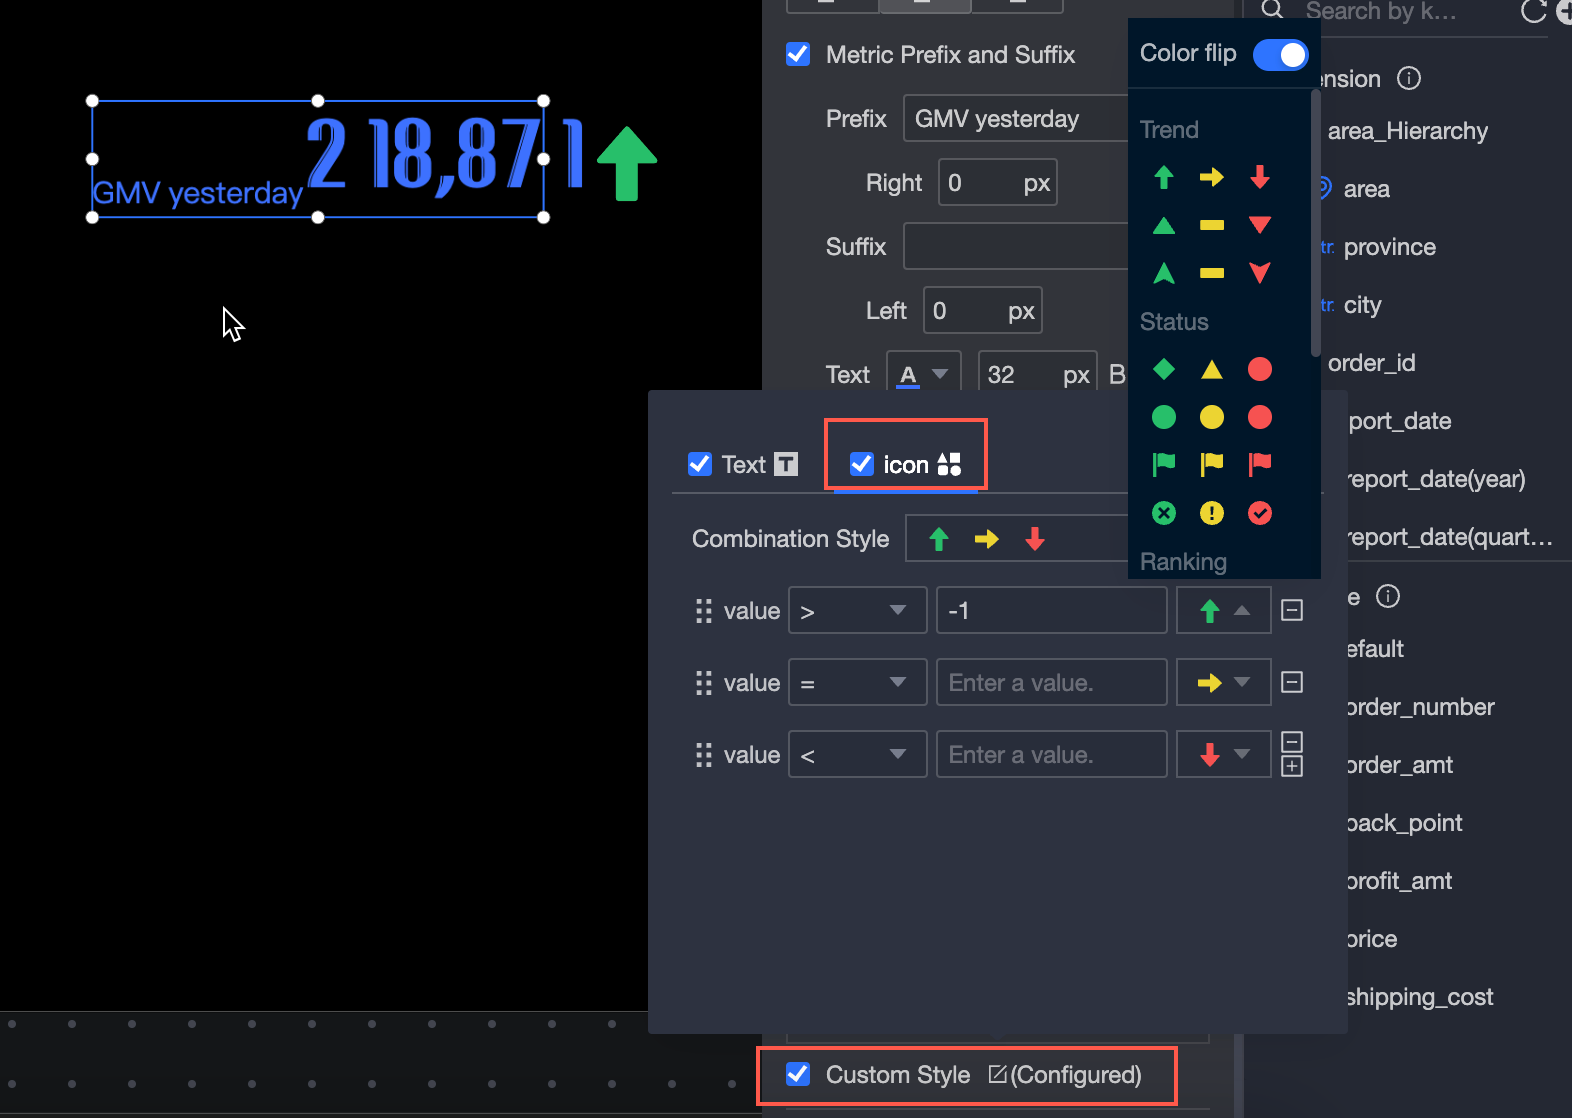
Custom Style: Customize text and icon styles, including conditions, marker icons, range values, and font colors.
-
Custom Text: Compare a condition against a static field or a dynamic field.
-
Custom Icon: Customize Conditional Selection and Combination Style.
-