This topic describes how to add data comparison for a measure field.
Prerequisites
A line chart that contains only one date field is created. For more information, see Line charts.
Limits
Only line charts support the data comparison feature.
You can use the data comparison feature when you specify only one field for Value Axis (Mea.).
You can use the data comparison feature when you specify only one field for Category Axis (Dim.).
After the data comparison feature is enabled, you can only view the data comparison results on the mobile terminal. You cannot change the comparison items.
The data comparison feature is not supported if one of the following features is enabled for a line chart: circling, prediction, exception detection, and fluctuation analysis.
Background information
The following table describes the data comparison feature for different date field types.
Date Field Type | Example | Data comparison description |
Year (in the format of yyyy) | Order Date (year) |
|
Quarter (in the format of yyyyqq) | Order Date (quarter) |
|
Month (in the format of yyyymm) | Order Date (month) |
|
Week (in the format of yyyy-ww) | Order Date (week) |
|
Day (in the format of yyyymmdd) | Order Date (day) |
|
Hour (in the format of hh), Minute (in the format of hh:mm), Second (in the format of hh:mm:ss), and date field in the format of yyyymmdd hh:mm:ss | Order Date (day), order date (minute), order date (second), Order Date (ymdhms) | Data comparison cannot be configured. |
The effect diagram is as follows. 
Example of configuring data comparison
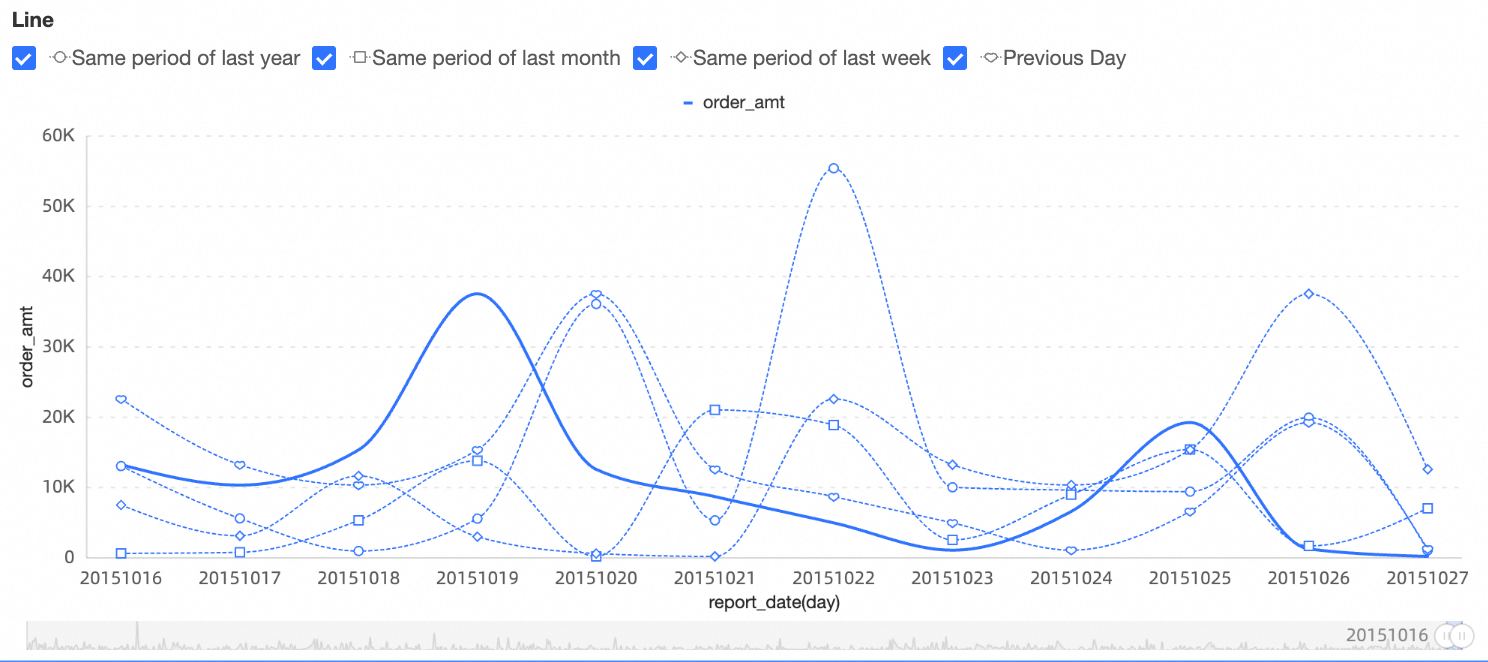
report_date(day)
The following steps are performed in a line chart:
Go to the dashboard edit page. For more information, see Create a dashboard.
On the Fields tab of the Data panel, add dimensions and measures.
In the Dimensions list, double-click order_date (day). You can also drag this dimension to Category Axis (Dimensions).
In the Measures list, double-click order_amt. You can also drag this measure to Value Axis (Mea.).
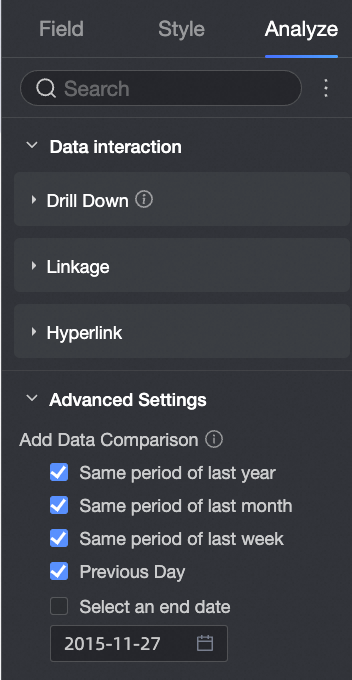
Click the Analysis tab. In the Advanced Settings section, configure Add Data Comparison.
By referring to this example, set the data comparison of the measure field order amount as the same period last year, the same period last month, the same period last week, the previous day, and the optional end date.
The chart is automatically updated based on the configured data comparison.
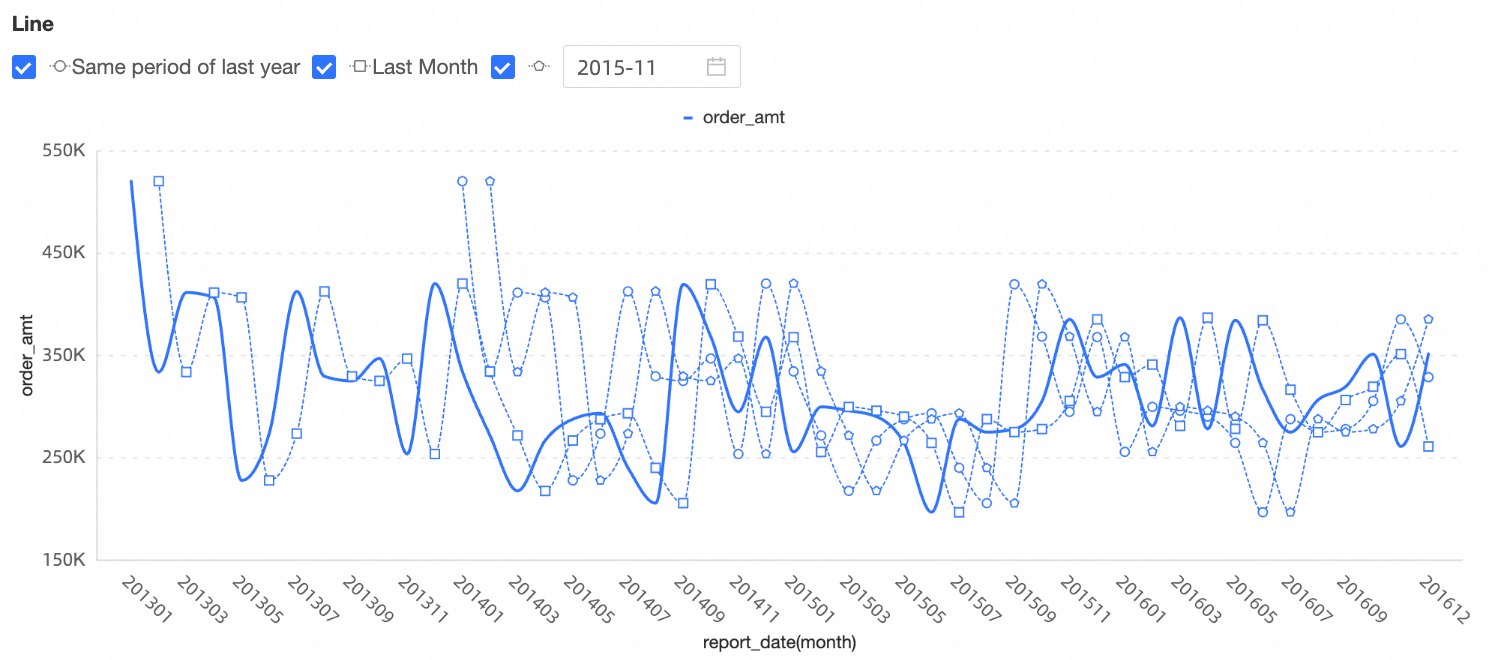
report_date(month)
The following steps are performed in a line chart:
Go to the dashboard edit page. For more information, see Create a dashboard.
On the Fields tab of the Data panel, add dimensions and measures.
In the Dimensions list, double-click order_date (month). You can also drag this dimension to Category Axis (Dimensions).
In the Measures list, double-click order_amt. You can also drag this measure to Value Axis (Mea.).
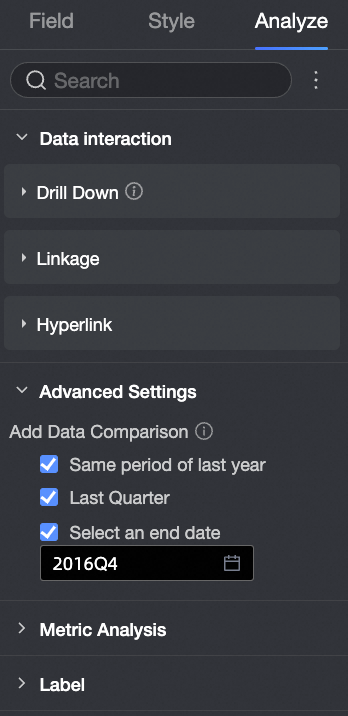
Click the Analysis tab. In the Advanced Settings section, configure Add Data Comparison.
Refer to this example to set the data comparison of the measurement field order amount as the same period last year, the previous month, and the optional end date.
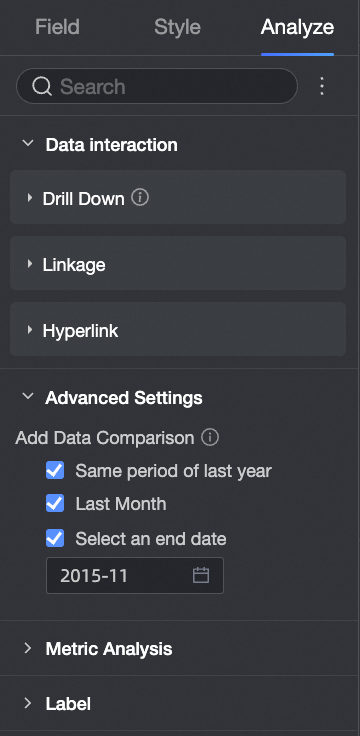
The chart is automatically updated based on the configured data comparison. The effect is as follows.
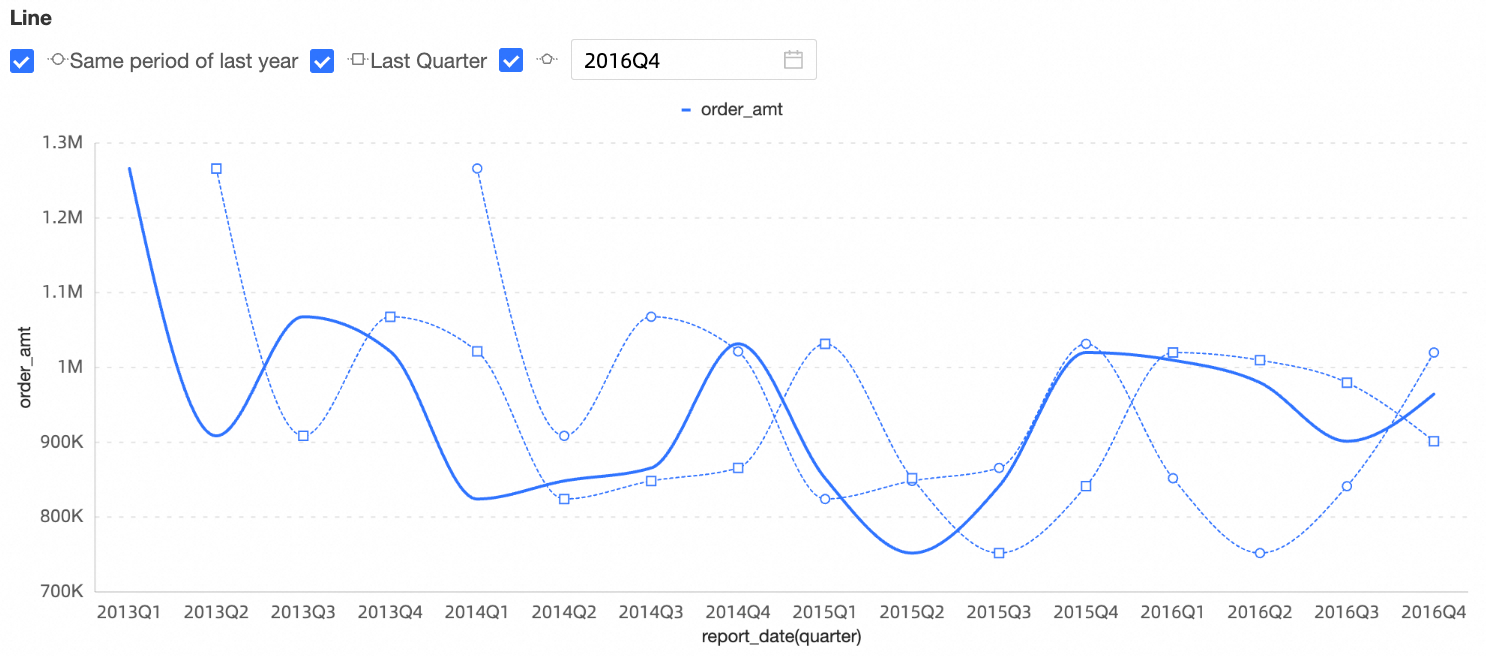
report_date(quarter)
The following steps are performed in a line chart:
Go to the dashboard edit page. For more information, see Create a dashboard.
On the Fields tab of the Data panel, add dimensions and measures.
In the Dimensions list, double-click order_date (quarter). You can also drag this dimension to Category Axis (Dimension).
In the Measures list, double-click orderamt. You can also drag orderamt to Value Axis (Mea.).
Click the Analysis tab. In the Advanced Settings section, configure Add Data Comparison.
Refer to this example to set the data comparison of the measurement field order amount to the same period last year, the previous quarter, and the optional end date.
The chart is automatically updated based on the configured data comparison. The effect is as follows.
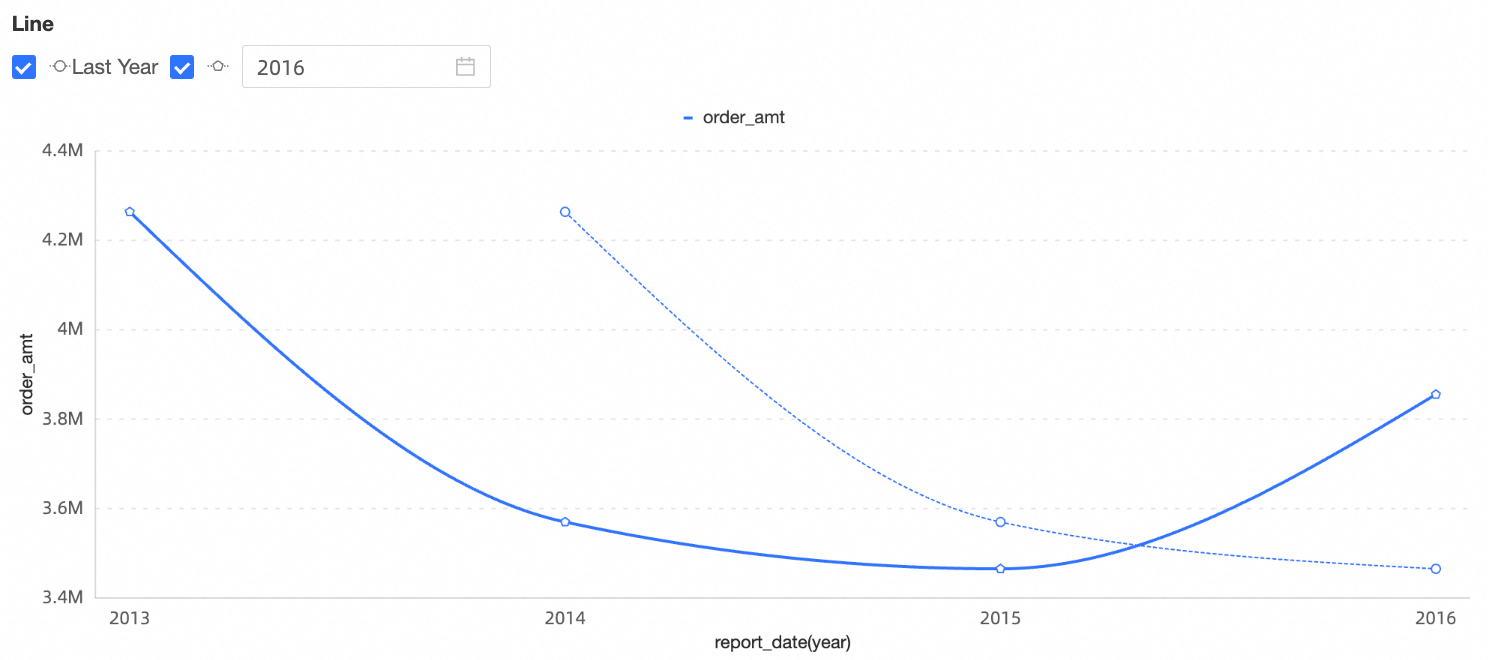
report_date(year)
The following steps are performed in a line chart:
Go to the dashboard edit page. For more information, see Create a dashboard.
On the Fields tab of the Data panel, add dimensions and measures.
In the Dimensions list, double-click order_date (year). You can also drag this dimension to Category Axis (Dimensions).
In the Measures list, double-click orderamt. You can also drag orderamt to Value Axis (Mea.).
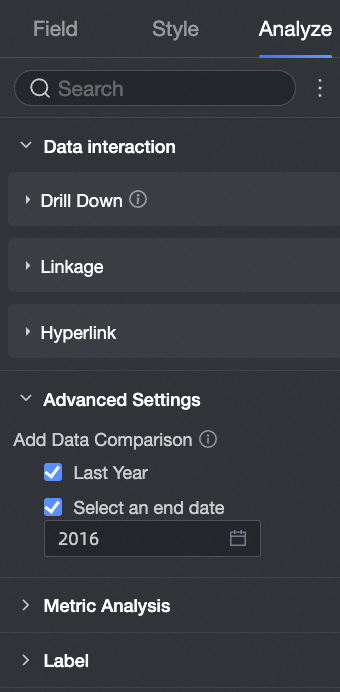
Click the Analysis tab. In the Advanced Settings section, configure Add Data Comparison.
Refer to this example to set the data comparison of the measurement field order amount to the same period last year and the optional end date.
The chart is automatically updated based on the configured data comparison. The effect is as follows.