When running stress tests, client-side metrics alone often cannot reveal whether a bottleneck originates in your application code, a downstream dependency, or the underlying infrastructure. End-to-end monitoring bridges this gap by connecting PTS stress testing scenarios with server-side observability, so you can trace performance issues to their root cause across every component in your system. You can specify server-side applications and Alibaba Cloud instances to monitor during stress testing.
End-to-end monitoring has two components that you can set up independently or together:
| Component | What it does | Observability service |
|---|---|---|
| Tracing Analysis | Connects distributed traces with stress test results to identify slow services or dependencies | Application Real-Time Monitoring Service (ARMS) |
| Cloud Product Monitoring | Pulls infrastructure metrics from your Alibaba Cloud services during a stress test | Managed Service for Prometheus |
After a stress test runs, monitoring data appears on the dashboard and in the stress testing report, where you can spot server performance inflection points.
Set up Tracing Analysis
Tracing Analysis integrates ARMS with your stress testing scenario. Once configured, PTS automatically correlates trace data with test results, letting you trace slow requests back to the responsible service or dependency.
When you add Tracing Analysis to a scenario, the system automatically activates Managed Service for OpenTelemetry Pro Edition and begins reporting trace data.
Prerequisites
Before you begin, make sure that you have:
Performance Testing (PTS) activated. For details, see Activate PTS
ARMS activated, with an ARMS agent attached or Managed Service for OpenTelemetry connected. For details, see Activate ARMS and Agent management
Add applications for tracing
Log on to the PTS console. Choose Performance Test > Create Scenario, and then click PTS.
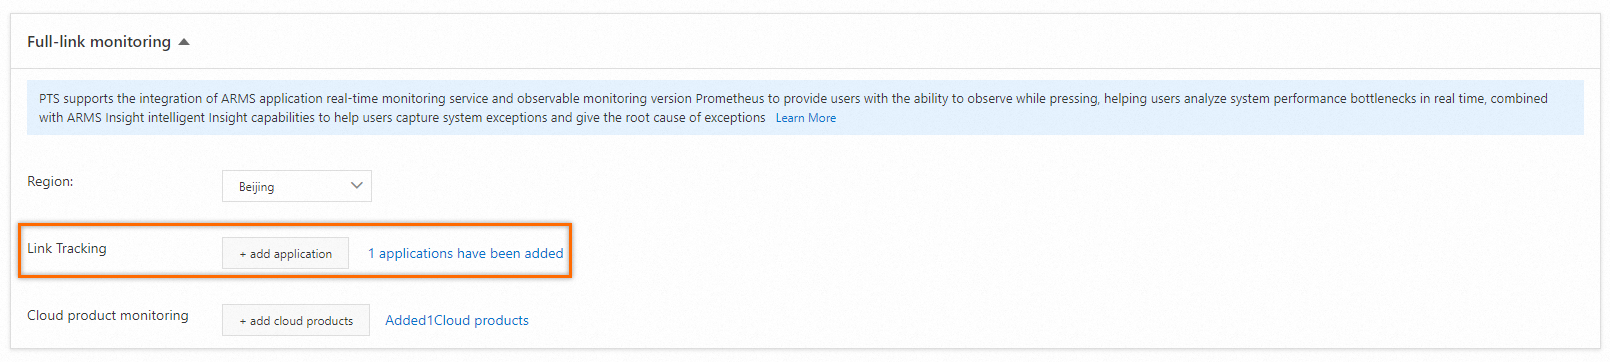
In the End-to-End Monitoring section, select a region from the Region drop-down list.
Click + Add Application next to Tracing Analysis.
In the Add Application panel, select the applications that you want to trace during the stress test. If no applications appear, create applications in the region you selected.
Set up cloud service monitoring
Cloud Product Monitoring pulls infrastructure metrics from Managed Service for Prometheus into your stress testing scenario. This lets you observe how your Alibaba Cloud services perform under load and identify infrastructure-level bottlenecks that contribute to application performance issues.
Prerequisites
Before you begin, make sure that you have:
PTS activated. For details, see Activate PTS
Managed Service for Prometheus activated. For details, see Activate Managed Service for Prometheus
A Prometheus instance created in the target region, integrated with the Alibaba Cloud services you want to monitor. For details, see Create a Prometheus instance to monitor Alibaba Cloud services
Add cloud services for monitoring
Log on to the PTS console. Choose Performance Test > Create Scenario, and then click PTS.
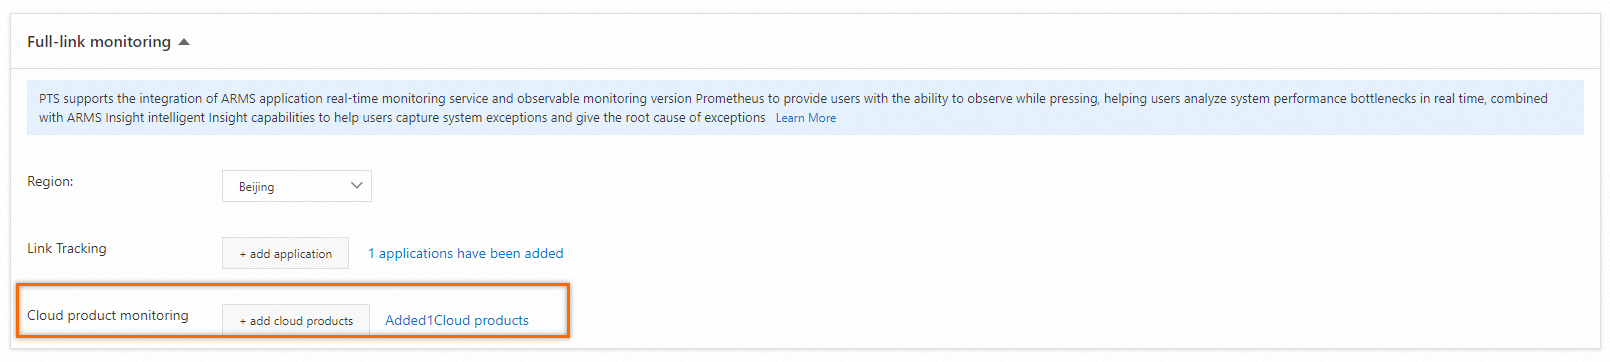
In the End-to-End Monitoring section, select a region from the Region drop-down list.
Click + Add Cloud Product next to Cloud Product Monitoring.
In the Add Cloud Product panel, select the Alibaba Cloud services that you want to monitor during the stress test.