The Metric Overview page of the Application Real-time Monitoring Service (ARMS) console provides an aggregated region-level metric list. You can view the amount, percentage, and metadata of metric data that is reported within one hour, one day, or one week by source, category, or measurement.
Prerequisites
ARMS is activated. For more information, see Activate ARMS.
Go to the Metric Overview page
Log on to the Managed Service for Prometheus console.
In the left-side navigation pane, choose .
Configure filtering
In the Quick Filter section, you can configure filter conditions, including source, category, and measurement.
Source: specifies the component whose metric data is integrated by using the integration center.
Category: specifies whether a metric is a basic metric or a custom metric. For more information, see Metrics.
In the text box at the top of the page, you can query one or more metrics by name. Fuzzy match is supported.
Metric list
The metric list displays the name, source, category, percentage, amount, and description of the reported metric data.

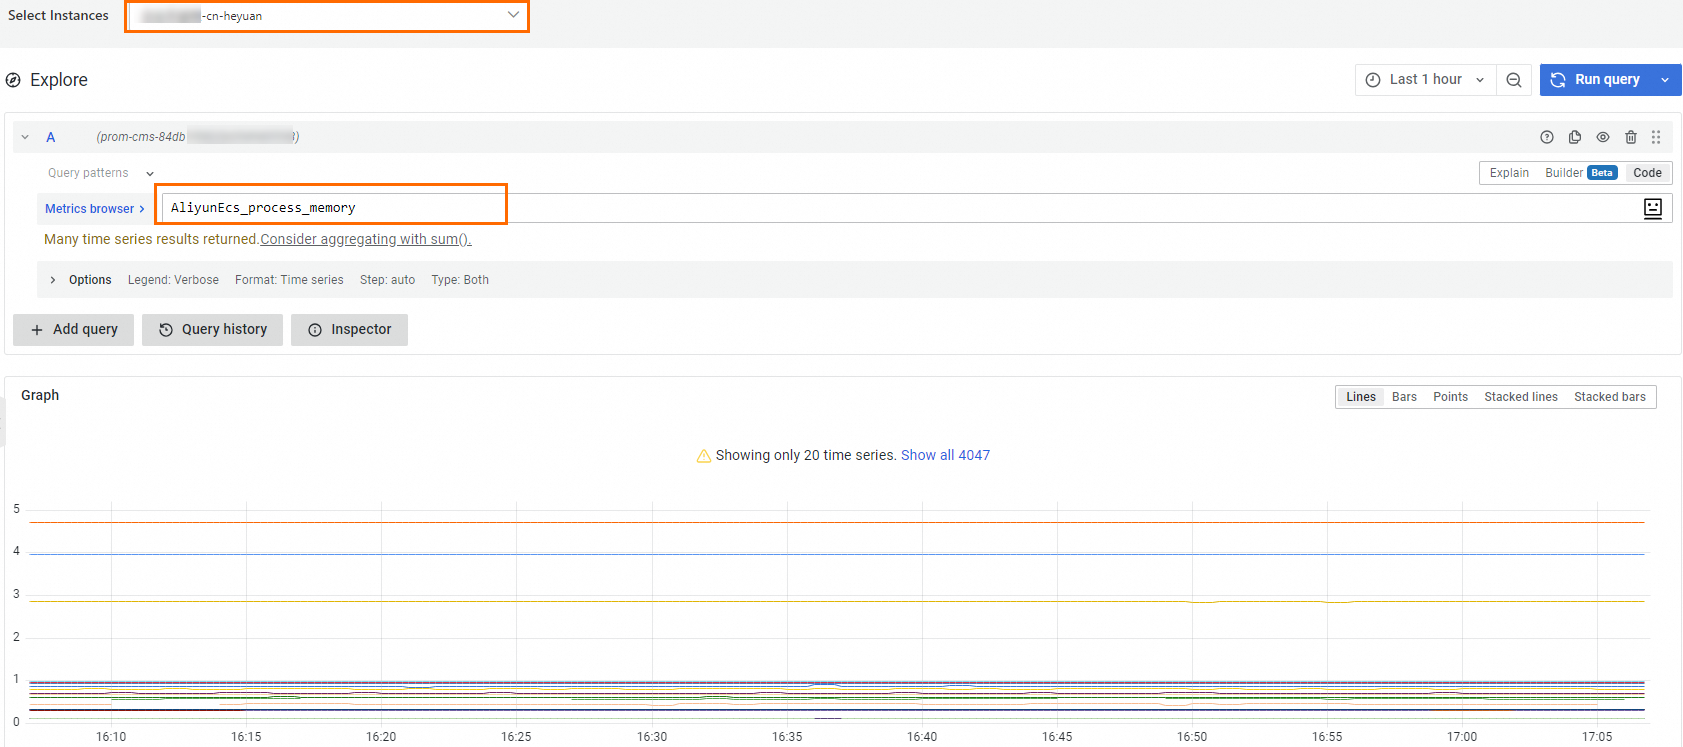
Find a metric and click the
 icon in the Number of Reported Metrics column to view the trends in one hour, one day, or one week.
Find a metric and click Details in the Actions column to view the metadata, amount of the reported data, and number of timelines of the metric. For more information, see the Metric details section.
Metric details
Basic Information
The Basic Information section displays the name, unit, measurement, collection interval, source, and collection jobs of a metric.
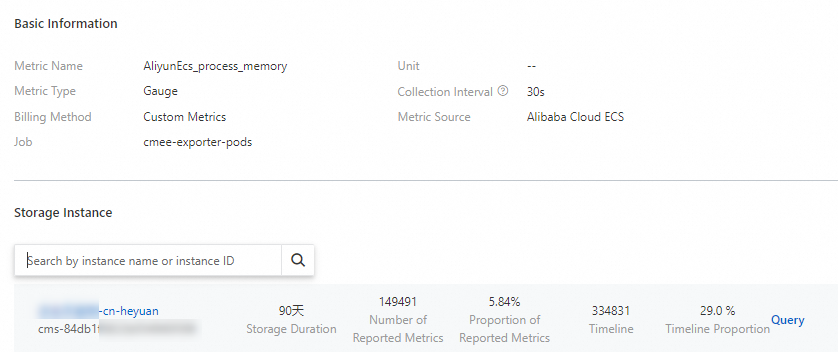
Storage Instance
The Storage Instance section displays the list of instances that store the data of a metric, and the storage duration, amount and percentage of the reported data, number of timelines, and percentage of timelines.
The timeline data is provided only in the China (Heyuan) region.
Find a storage instance and click Search to query the metric details.