You can use a Prometheus Query Language (PromQL) statement to query whether data is collected to an environment. The Metrics Explorer in Managed Service for Prometheus lets you run PromQL queries directly against the metric store of an environment.
Prerequisites
Before you begin, make sure that you have:
Activated Application Real-Time Monitoring Service (ARMS). For more information, see Activate ARMS.
A Prometheus environment that is actively ingesting metrics. If no data is being collected, the Metrics Explorer returns empty results.
Open the Metrics Explorer
Log on to the Managed Service for Prometheus console.
In the left-side navigation pane, click Integration Management.
On the Integrated Environments tab, click the name of the environment that you want to explore.
On the environment details page, click the Metrics Explorer tab.
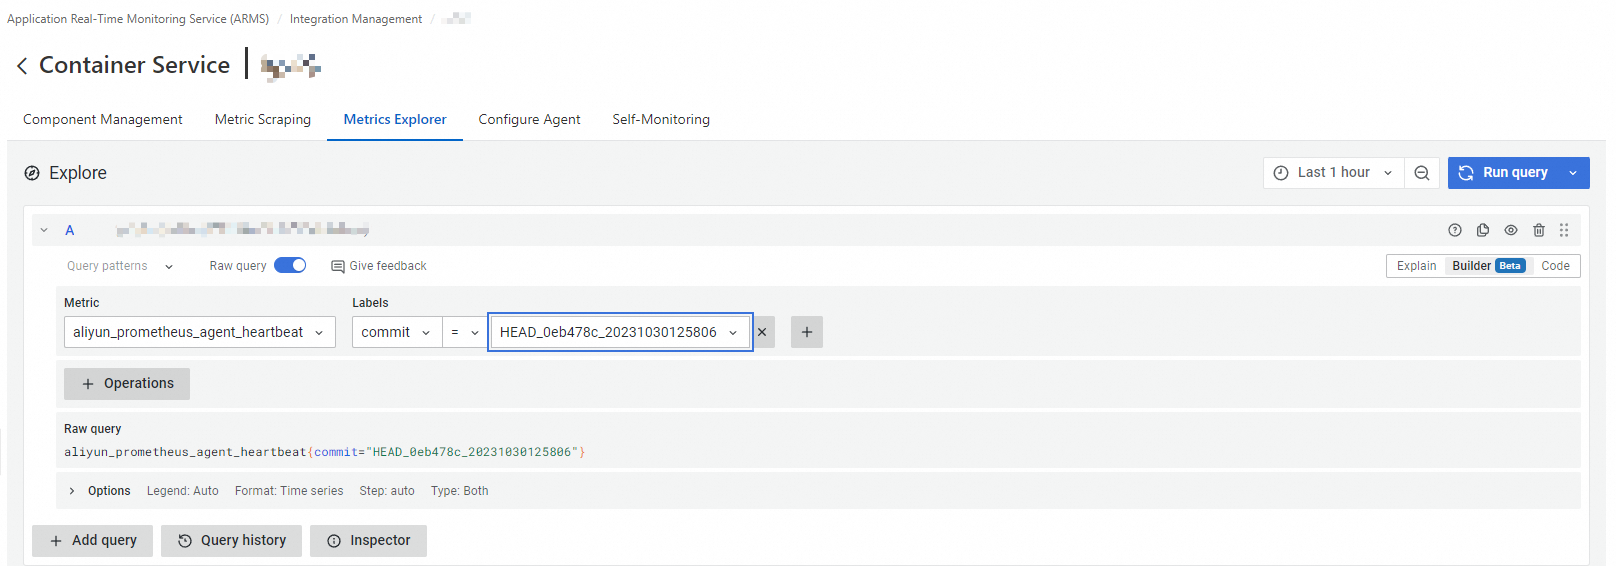
Query metrics
In the Explore section, configure the following parameters and click Run query. The query runs against the Prometheus instance associated with the environment.
| Parameter | Description |
|---|---|
| Metric | The metric to query. Select a metric from the list of available metrics in the environment. |
| Labels | Label filters that narrow the query scope. You can add multiple label filters to refine your results. |
| Options | Additional query settings such as the time range and output preferences. |
For the complete PromQL syntax reference, see PromQL syntax.