Managed Service for Prometheus lets you visualize monitoring data by using Grafana dashboards. You can create a custom dashboard or import one from the official Grafana website. This topic shows how to create a custom Grafana dashboard for a sample application that is deployed in a Container Service for Kubernetes (ACK) cluster and uses Container Registry.
Prerequisites
- An ACK cluster is integrated with Managed Service for Prometheus. For more information, see Prometheus instances for ACK.
- An is created in Container Registry. For more information, see Step 2: Create an image repository.
Procedure
The following diagram shows the workflow for creating a custom Grafana dashboard with Managed Service for Prometheus.

Step 1: Upload the application
Build an image for your application and push it to an image repository in Container Registry.
- Run the following command to recompile the module.
mvn clean install -DskipTests - Run the following command to build the image.
docker build -t <your-image-name>:<your-image-tag> . --no-cacheExample:docker build -t promethues-demo:v0 . --no-cache - Run the following command to tag the image.
sudo docker tag <your-image-name>:<your-image-tag> <registry-domain>/<namespace>/<image-name>:<image-tag>Example:sudo docker tag promethues-demo:v0 registry.cn-hangzhou.aliyuncs.com/testnamespace/promethues-demo:v0 - Run the following command to push the image to the image repository.
sudo docker push <registry-domain>/<namespace>/<image-name>:<image-tag>Example:sudo docker push registry.cn-hangzhou.aliyuncs.com/testnamespace/promethues-demo:v0In the Container Registry console, the uploaded application image appears on the Image Version page.
Step 2: Deploy the application
Deploy the application to your ACK cluster.
Log on to the ACK console.
- In the left-side navigation pane, click Cluster.
- On the Clusters page, find your cluster, and in the Actions column, click Applications.
- Create a deployment.
- In the left-side navigation pane, choose .
- On the Deployments page, click Create Resources in YAML.
- On the Create page, enter the following YAML in the Template editor and click Create.
apiVersion: apps/v1 # for versions before 1.8.0 use apps/v1beta1 kind: Deployment metadata: name: prometheus-demo spec: replicas: 2 template: metadata: annotations: prometheus.io/scrape: 'true' prometheus.io/path: '/prometheus-metrics' prometheus.io/port: '8081' labels: app: tomcat spec: containers: - name: tomcat imagePullPolicy: Always image: <registry-domain>/<namespace>/<image-name>:<image-tag> ports: - containerPort: 8080 name: tomcat-normal - containerPort: 8081 name: tomcat-monitorExample:apiVersion: apps/v1 # for versions before 1.8.0 use apps/v1beta1 kind: Deployment metadata: name: prometheus-demo labels: app: tomcat spec: replicas: 2 selector: matchLabels: app: tomcat template: metadata: annotations: prometheus.io/scrape: 'true' prometheus.io/path: '/prometheus-metrics' prometheus.io/port: '8081' labels: app: tomcat spec: containers: - name: tomcat imagePullPolicy: Always image: registry.cn-hangzhou.aliyuncs.com/peiyu-test/prometheus-demo:v0 ports: - containerPort: 8080 name: tomcat-normal - containerPort: 8081 name: tomcat-monitor
The created appears on the Deployments page.
- Create a service.
- In the left-side navigation pane, choose .
- On the Services page, click Create Resources in YAML.
- On the Create page, enter the following YAML in the Template editor and click Create.
apiVersion: v1
kind: Service
metadata:
  labels:
    app: tomcat
  name: tomcat
  namespace: default
spec:
  ports:
  - name: tomcat-normal
    port: 8080
    protocol: TCP
    targetPort: 8080
  - name: tomcat-monitor
    port: 8081
    protocol: TCP
    targetPort: 8081
  type: NodePort
  selector:
    app: tomcat
The created appears on the Services page.
Step 3: Configure a collection rule
By default, Managed Service for Prometheus monitors basic metrics for CPU, memory, and network. To monitor additional data, such as order information, you must create a custom data collection rule in Managed Service for Prometheus.
-
Log on to the Cloud Monitor console.
-
In the navigation pane on the left, choose to open the instance list for Managed Service for Prometheus.
- Click the name of your Prometheus instance.
- Configure a data collection rule for your application based on the following scenarios.
- To monitor business data from an application deployed in the ACK cluster, such as order information, do the following
- In the left-side navigation pane, click Service Discovery, and then click the Configure tab.
- On the Configure page, click the ServiceMonitor tab, and then click Add ServiceMonitor.
- In the dialog box that appears, enter the following content and click OK.
apiVersion: monitoring.coreos.com/v1
kind: ServiceMonitor
metadata:
  # Enter a unique name.
  name: tomcat-demo
  # Enter the target namespace.
  namespace: default
spec:
  endpoints:
  - interval: 30s
    # Set this to the `name` of the port for the Prometheus exporter, as defined in your Service YAML.
    port: tomcat-monitor
    # Set this to the path of the Prometheus exporter.
    path: /metrics
  namespaceSelector:
    any: true
    # The namespace of the demo application.
  selector:
    matchLabels:
      # Set this to the label value from your Service YAML to target the correct service.
      app: tomcat
On the ServiceMonitor tab, the configured service discovery is displayed.

- To monitor business data from a source outside the ACK cluster, such as the number of Redis connections, do the following
- In the left-side navigation pane, click Settings. On the Settings page, click Edit Prometheus.yaml.
- In the dialog box that appears, enter the following content and click Save.
global:
  scrape_interval:     15s # Set the scrape interval to every 15 seconds. Default is every 1 minute.
  evaluation_interval: 15s # Evaluate rules every 15 seconds. The default is every 1 minute.
scrape_configs:
  - job_name: 'prometheus'
    static_configs:
    - targets: ['localhost:9090']
- To monitor business data from an application deployed in the ACK cluster, such as order information, do the following
Step 4: Configure the dashboard
Configure a Grafana dashboard to display your data.
- Go to the Grafana dashboard overview page.
Note The Expert Edition for Grafana must be enabled.
- In the left-side navigation pane, choose
 > + New dashboard.
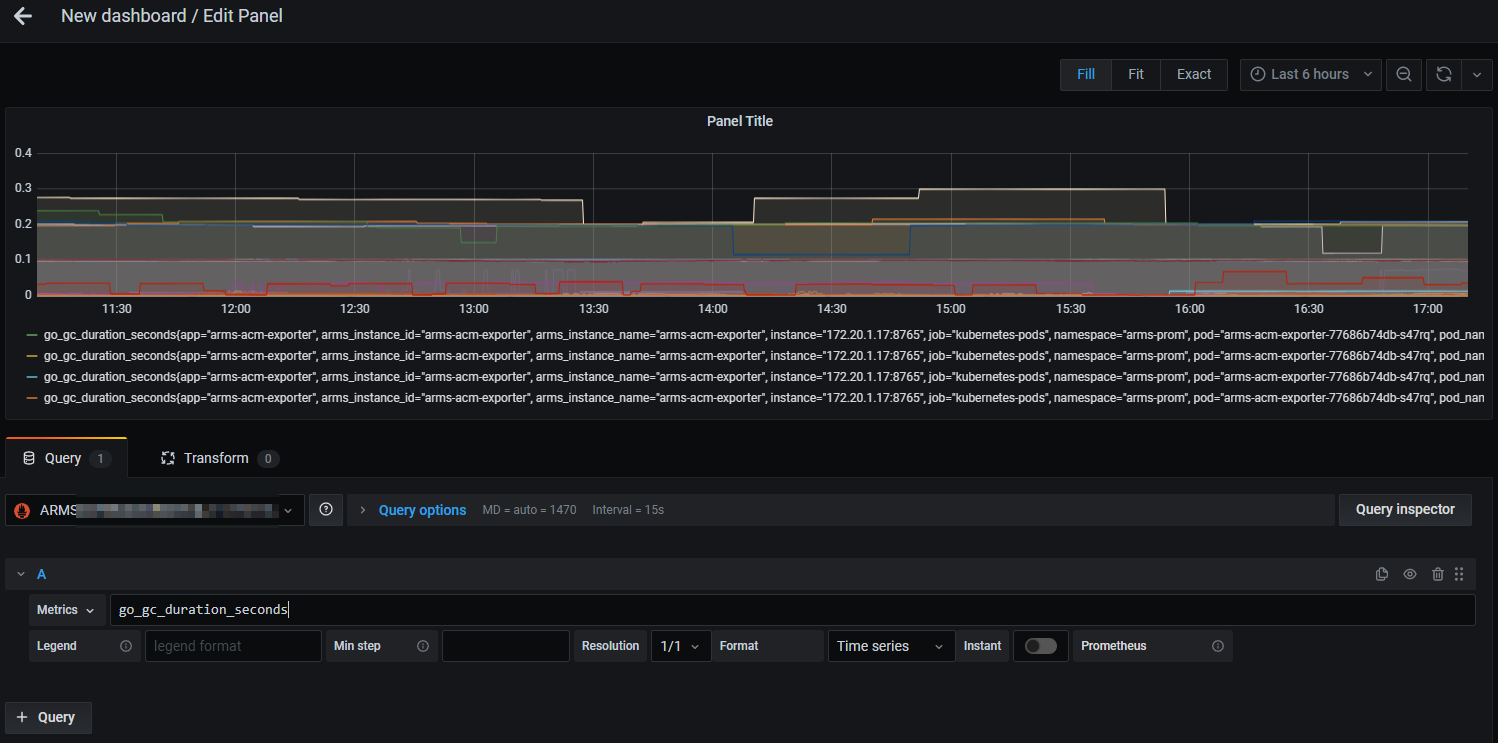
 - On the New dashboard page, click Add a new panel.
- On the Edit Panel page, on the Query tab, select your cluster from the top drop-down list. In section A, select a metric, such as go_gc_duration_seconds, from the Metrics drop-down list.
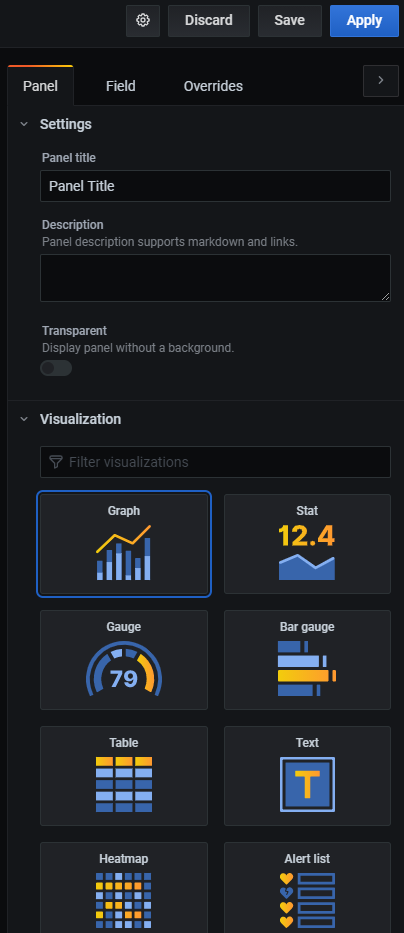
- In the right-side panel, name the chart, select a visualization type such as a graph, table, or heatmap, and configure other parameters as needed.
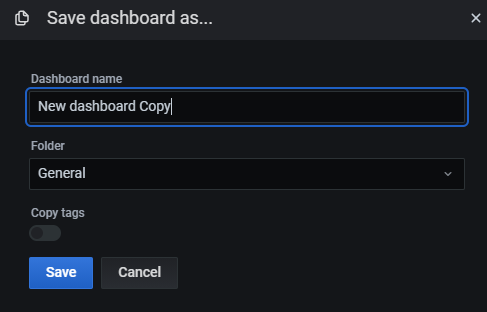
- Click Save in the upper-right corner. In the dialog box that appears, name the dashboard, select a cluster, and then click Save.
You can create multiple dashboards and charts as needed.
 The following figure shows the configured Grafana dashboard.
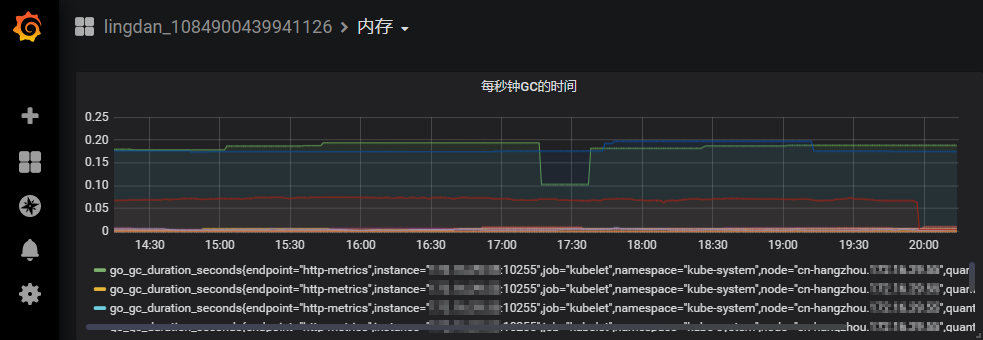
Step 5: Monitor complex metrics
To monitor metrics that require complex calculations, build and test the PromQL query in Managed Service for Prometheus.
- Go to the Grafana dashboard overview page.
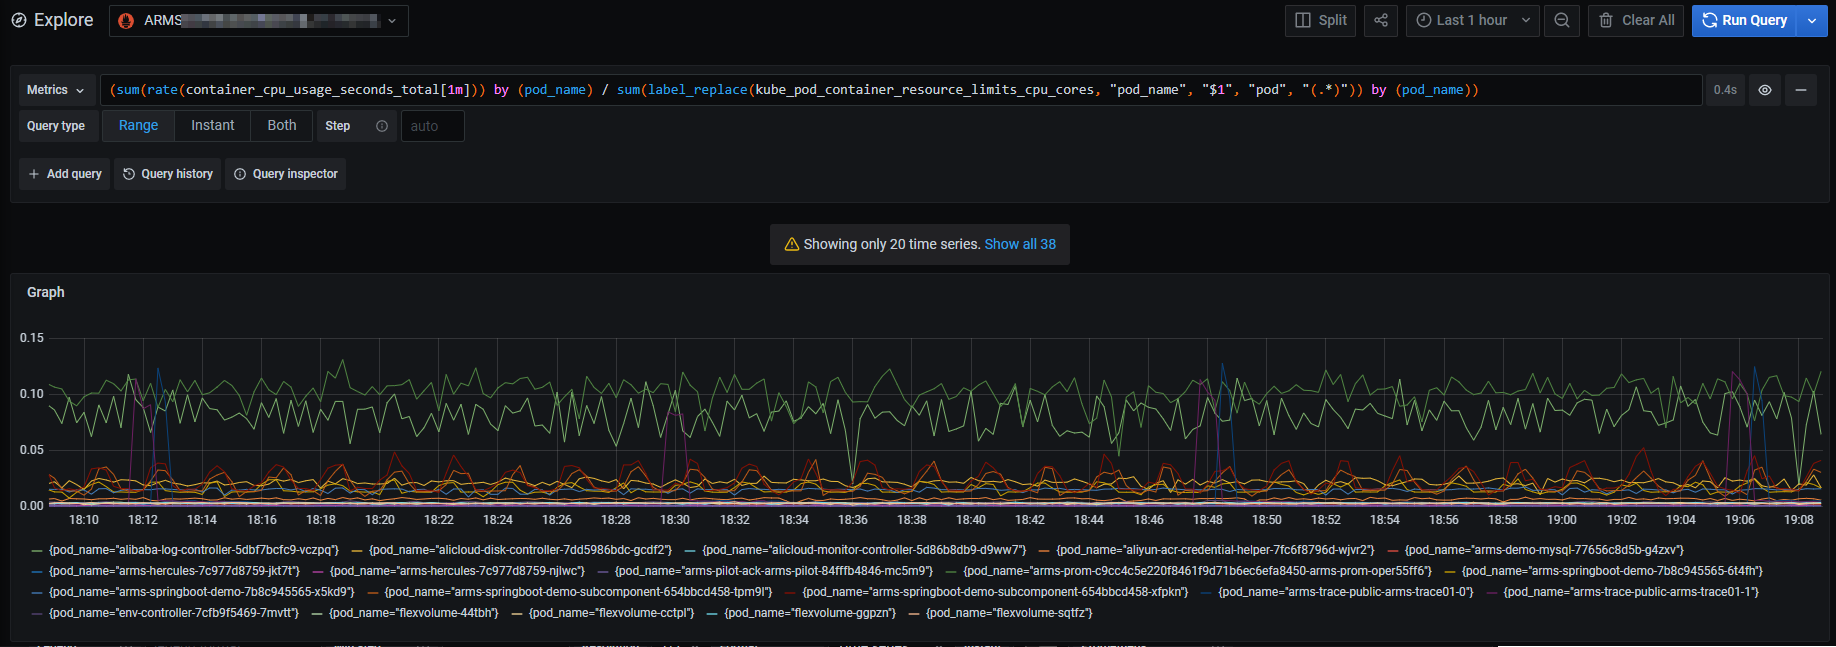
- In the left-side navigation pane, click the Explore icon.
- On the Explore page, select your cluster from the drop-down list at the top. Enter a PromQL statement in the Metrics field and click Run Query in the upper-right corner to test it.
- After the query runs successfully, you can add a new panel or dashboard. For more information, see Step 4: Configure the dashboard.
Step 6: Create an alert
To create an alert rule for monitoring metrics, see Create a Prometheus alert rule.