Add custom key-value tags to Prometheus-collected ECS metrics in a VPC for fine-grained filtering and analysis in tools such as Grafana.
Prerequisites
-
A VPC is created. Create a VPC with an IPv4 CIDR block.
-
An ECS instance is created in the VPC. Create an instance.
Usage notes
-
Tag keys cannot contain hyphens (-), periods (.), percent signs (%), or other special characters reserved by Prometheus.
-
Tags must use a format required by Prometheus.
Procedure
Choose one of the following methods:
Method 1: Automatically add tags
Tags with the o11y.aliyun.dev/ prefix are automatically injected into metrics, simplifying filtering and management.
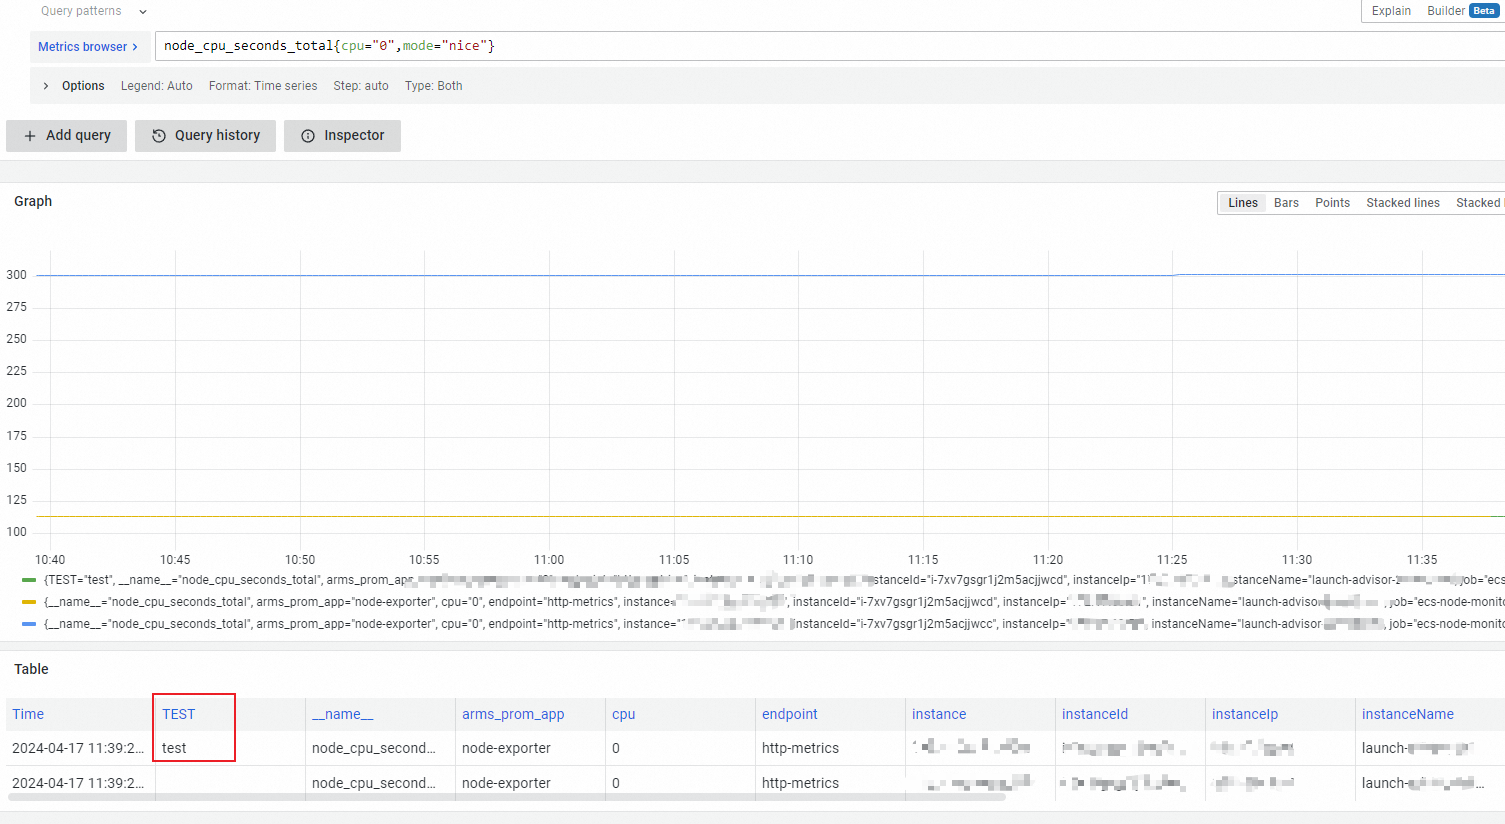
Tags with the o11y.aliyun.dev/ prefix are automatically injected into the corresponding metrics.
-
Configure tags for the ECS instance. Modify the tags of an instance.

-
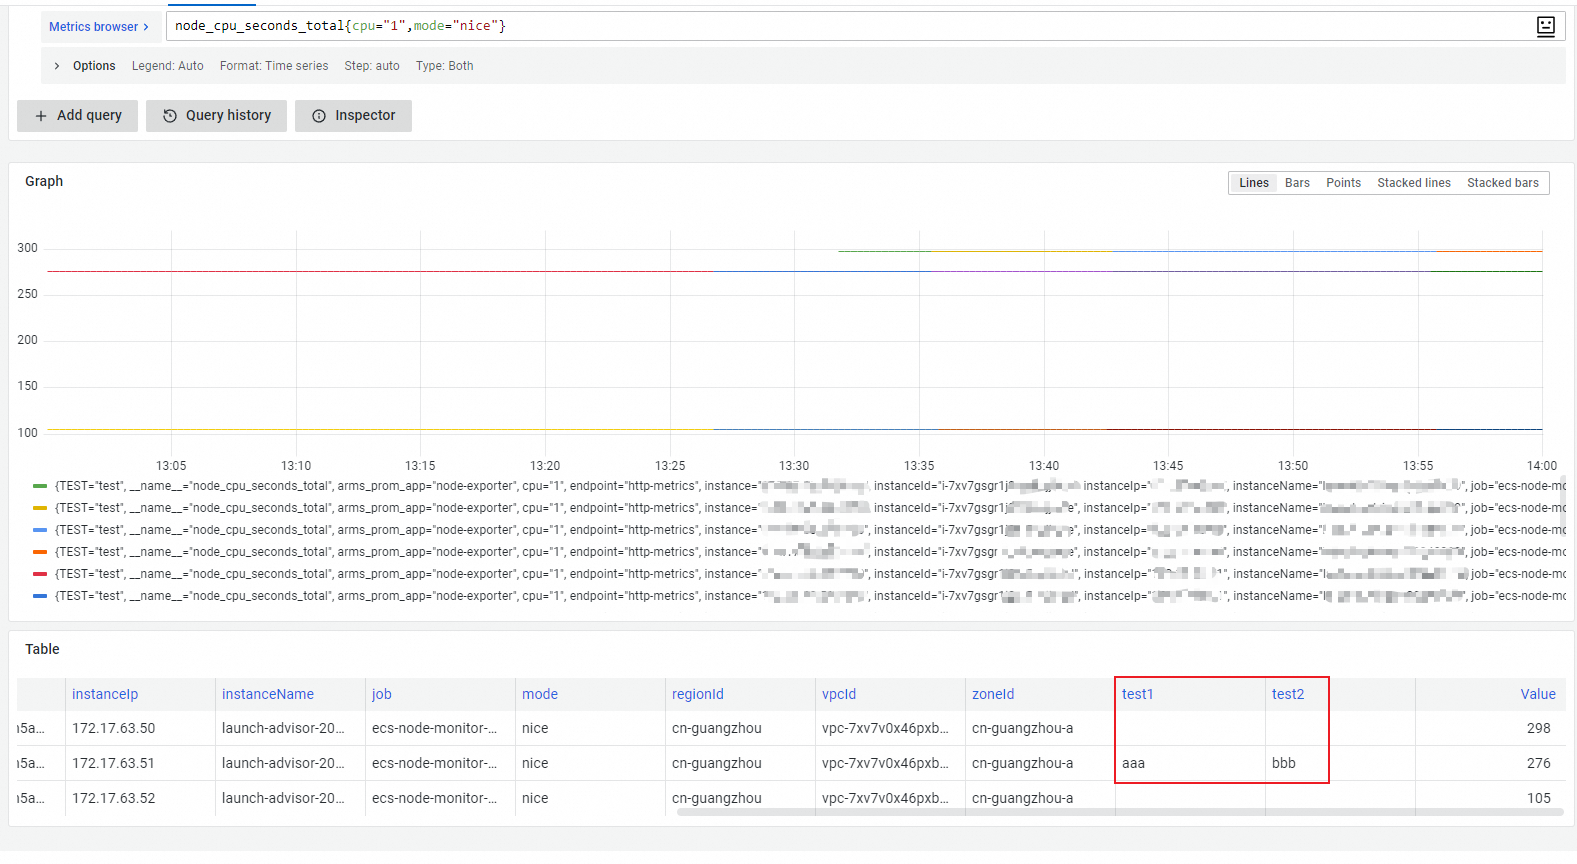
On the Metric Exploration tab of the environment details page in Integration Management, tags have been added. Explore the metric data of an environment.
-
Enable the ECS component first. Monitor ECS instances.
-
Automatic prefix-based tag injection applies only to Node Exporter metrics.
Method 2: Manually add tags
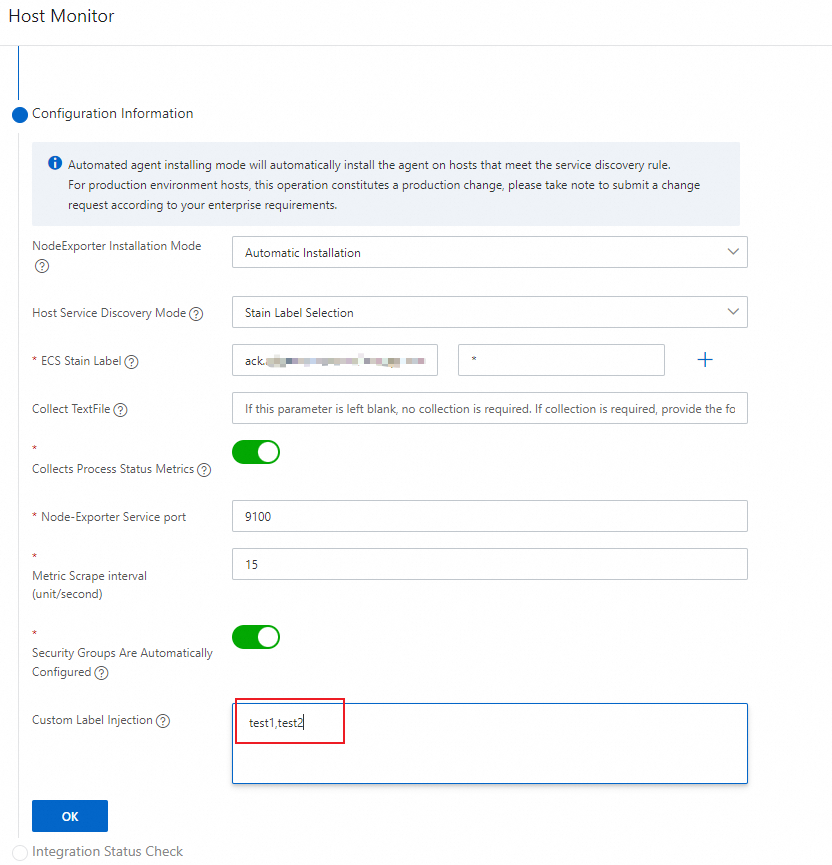
Manually specify custom tags when enabling the ECS component. Separate multiple tags with commas (,).
-
Configure tags for the ECS instance. Modify the tags of an instance.

-
In the Host Monitor panel, enter the tag keys from the previous step in the Custom ECS Tag Injection field. Monitor ECS instances.
-
On the Metric Exploration tab of the environment details page in Integration Management, tags have been added. Explore the metric data of an environment.