View how much physical storage your PolarDB for PostgreSQL cluster is consuming directly from the PolarDB console. Storage usage is measured at the file system level and reflects the actual physical space occupied by your cluster on disk.
Prerequisites
Before you begin, ensure that you have:
A PolarDB for PostgreSQL cluster (centralized or Distributed Edition)
Access to the PolarDB console
Procedure
View storage usage for centralized clusters
Log on to the PolarDB console. In the left navigation pane, click Clusters.
Select the region where your cluster is located, then click the cluster ID to open the cluster details page.
On the Basic Information page, scroll to the Distributed Storage section. The Database Storage Usage field shows the current physical storage consumed by your cluster.
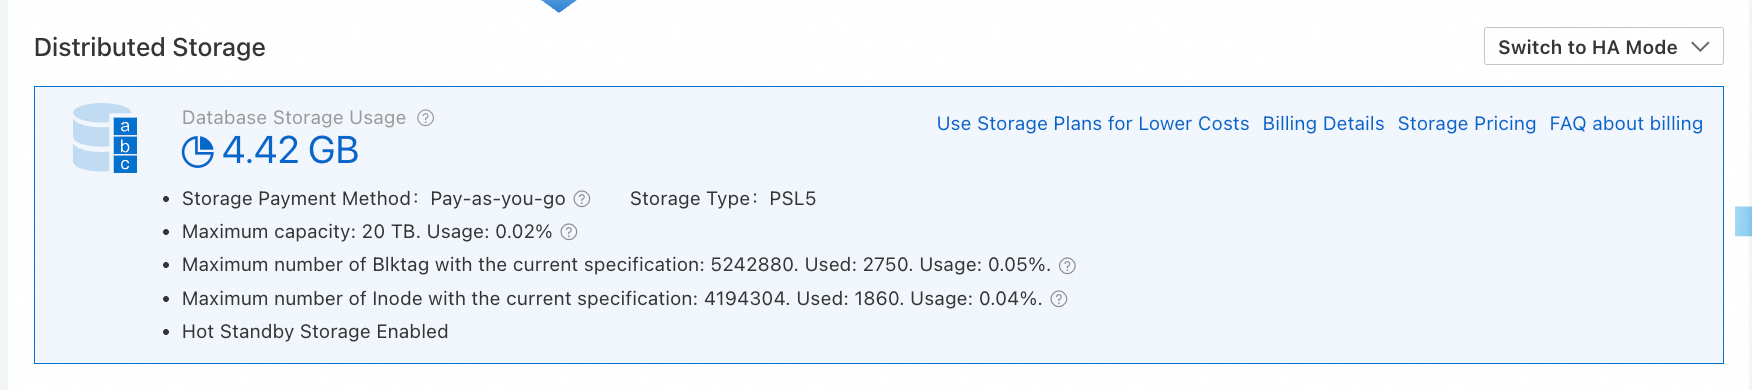
Each cluster specification has a maximum storage capacity. If storage usage is approaching the limit, upgrade your cluster specification to increase capacity. For details, see Change specifications.
View storage usage for Distributed Edition clusters
Log on to the PolarDB console. In the left navigation pane, click Clusters.
Select the region where your cluster is located, then click the cluster ID to open the cluster details page.
On the Basic Information page, scroll to the Cluster Topology section. The Storage Size for each node is shown in List View, as illustrated in the following figure.
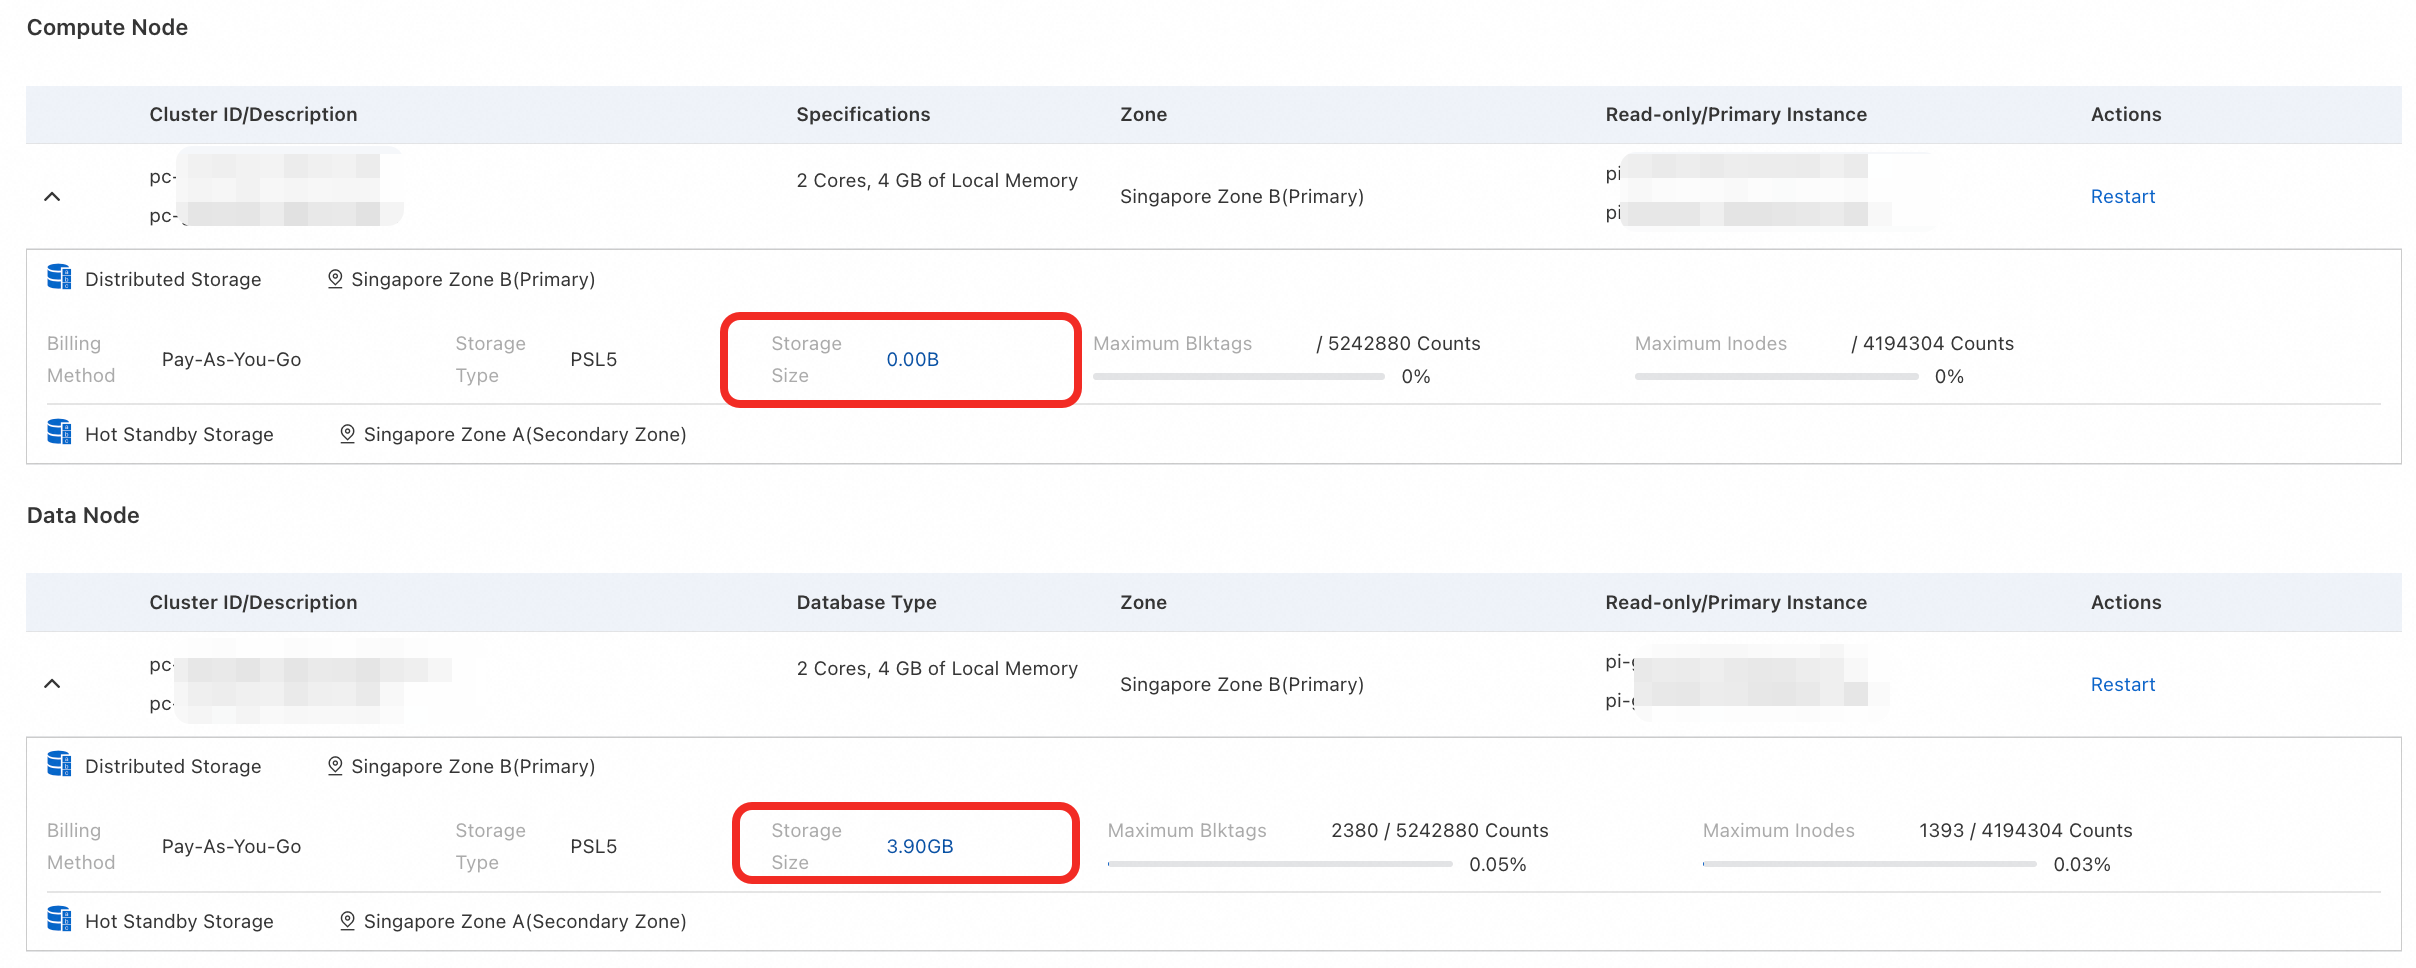
Each cluster specification has a maximum storage capacity. If storage usage is approaching the limit, upgrade your cluster specification to increase capacity. For details, see Change specifications.
FAQ
Why does the storage size from an SQL statement differ from what the console shows?
SQL statements return the logical size of the destination database. The console shows the physical storage size measured at the file system level. Because the two metrics measure different things, their values will generally differ.