This page covers the online analytical processing (OLAP) performance of PolarDB for MySQL 8.0.1 Cluster Edition with the In-Memory Column Index (IMCI) feature enabled. Results are measured using the TPC-H benchmark at three dataset scales: 100 GB, 1 TB, and 3 TB.
IMCI overview
PolarDB for MySQL uses IMCI to accelerate complex queries on large datasets in OLAP scenarios. IMCI enables a unified hybrid transaction/analytical processing (HTAP) solution for both real-time transaction processing and data analytics within the same cluster.
The following figure shows the IMCI architecture in PolarDB for MySQL.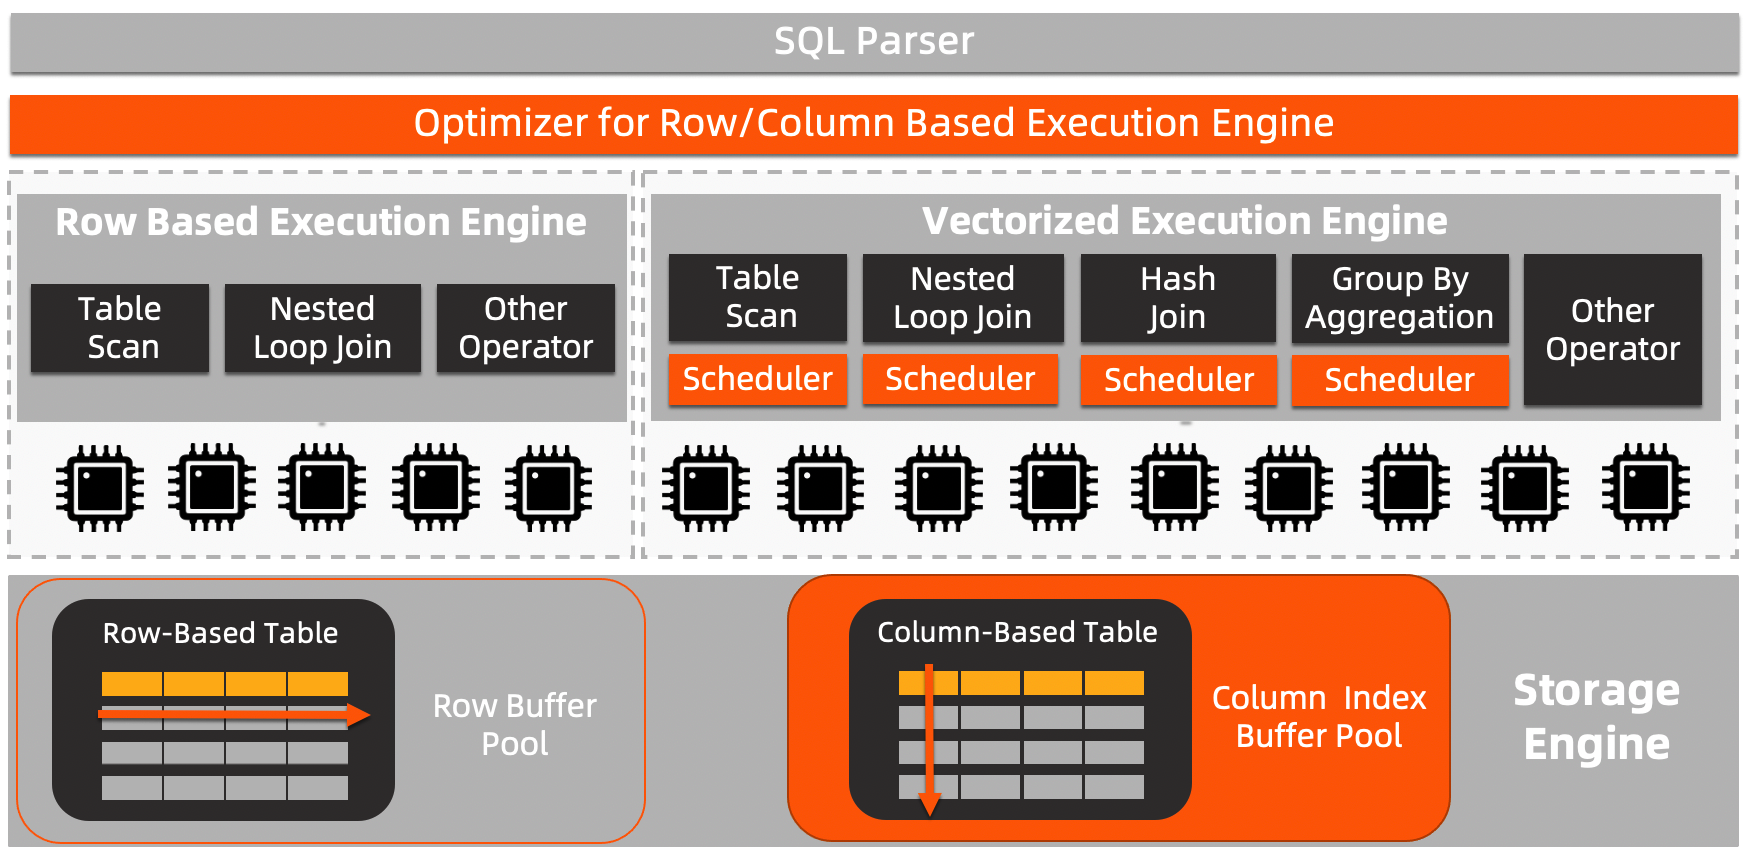
For an architectural overview, see In-Memory Column Index.
Usage notes
Enable IMCI as needed. After enabling, add read-only column store nodes to handle OLAP query requests. See Add a read-only column store node for IMCI.
To test IMCI performance in isolation, create a custom read-only database proxy endpoint that routes traffic directly to the read-only column store node. See Manually route traffic between row store and column store nodes in scenarios where OLTP and OLAP services are separated.
For IMCI performance tests, do not create secondary indexes on the TPC-H tables.
Performance tests
All tests run the 22 TPC-H queries (Q1–Q22) against a column store with IMCI enabled, unless otherwise noted.
TPC-H 100 GB
Test environment 1: 32-core 256 GB nodes
This test compares query performance between the column store (IMCI enabled) and the row store (IMCI disabled) on a 100 GB TPC-H dataset. It also shows how query time scales as you add column store nodes.
The times shown are not from the first run.
| SQL query | Row store — IMCI disabled (1 node, seconds) | IMCI enabled (1 node, seconds) | IMCI enabled (2 nodes, seconds) | IMCI enabled (3 nodes, seconds) | IMCI enabled (4 nodes, seconds) | Acceleration ratio (column vs. row) | Multi-node scale factor |
|---|---|---|---|---|---|---|---|
| Q1 | 2495.05 | 1.846 | 0.986 | 0.836 | 0.642 | 1351.60 | 0.72 |
| Q2 | 13.18 | 0.191 | 0.146 | 0.142 | 0.117 | 69.01 | 0.41 |
| Q3 | 345.56 | 0.482 | 0.292 | 0.192 | 0.165 | 716.93 | 0.73 |
| Q4 | 63.78 | 0.364 | 0.163 | 0.141 | 0.098 | 175.22 | 0.93 |
| Q5 | 251.48 | 0.475 | 0.383 | 0.256 | 0.227 | 529.43 | 0.52 |
| Q6 | 241.7 | 0.209 | 0.123 | 0.115 | 0.097 | 1156.46 | 0.54 |
| Q7 | 174.91 | 0.513 | 0.356 | 0.232 | 0.195 | 340.96 | 0.66 |
| Q8 | 560.82 | 0.454 | 0.279 | 0.234 | 0.196 | 1235.29 | 0.58 |
| Q9 | 450.68 | 1.875 | 0.914 | 0.708 | 0.542 | 240.36 | 0.86 |
| Q10 | 895.75 | 1.361 | 0.684 | 0.71 | 0.488 | 658.16 | 0.70 |
| Q11 | 30.03 | 0.19 | 0.148 | 0.119 | 0.105 | 158.05 | 0.45 |
| Q12 | 266.14 | 0.626 | 0.388 | 0.265 | 0.206 | 425.14 | 0.76 |
| Q13 | 780.74 | 1.505 | 1.022 | 0.935 | 0.616 | 518.76 | 0.61 |
| Q14 | 72.04 | 0.307 | 0.263 | 0.165 | 0.135 | 234.66 | 0.57 |
| Q15 | 261.77 | 0.428 | 0.363 | 0.32 | 0.275 | 611.61 | 0.39 |
| Q16 | 40.69 | 0.569 | 0.384 | 0.312 | 0.249 | 71.511 | 0.57 |
| Q17 | 57.75 | 0.544 | 1.388 | 1.195 | 1.054 | 106.16 | 0.13 |
| Q18 | 257.66 | 1.43 | 0.955 | 0.649 | 0.499 | 180.18 | 0.72 |
| Q19 | 19.17 | 1.076 | 0.581 | 0.53 | 0.405 | 17.816 | 0.66 |
| Q20 | 143.97 | 0.372 | 0.37 | 0.32 | 0.282 | 387.02 | 0.33 |
| Q21 | 293.99 | 1.142 | 0.56 | 0.463 | 0.356 | 257.43 | 0.80 |
| Q22 | 18.81 | 0.352 | 0.382 | 0.358 | 0.306 | 53.44 | 0.29 |
| Total | 7735.67 | 16.311 | 11.13 | 9.197 | 7.255 | 474.26 | 0.56 |
The following figure compares query times before and after IMCI is enabled.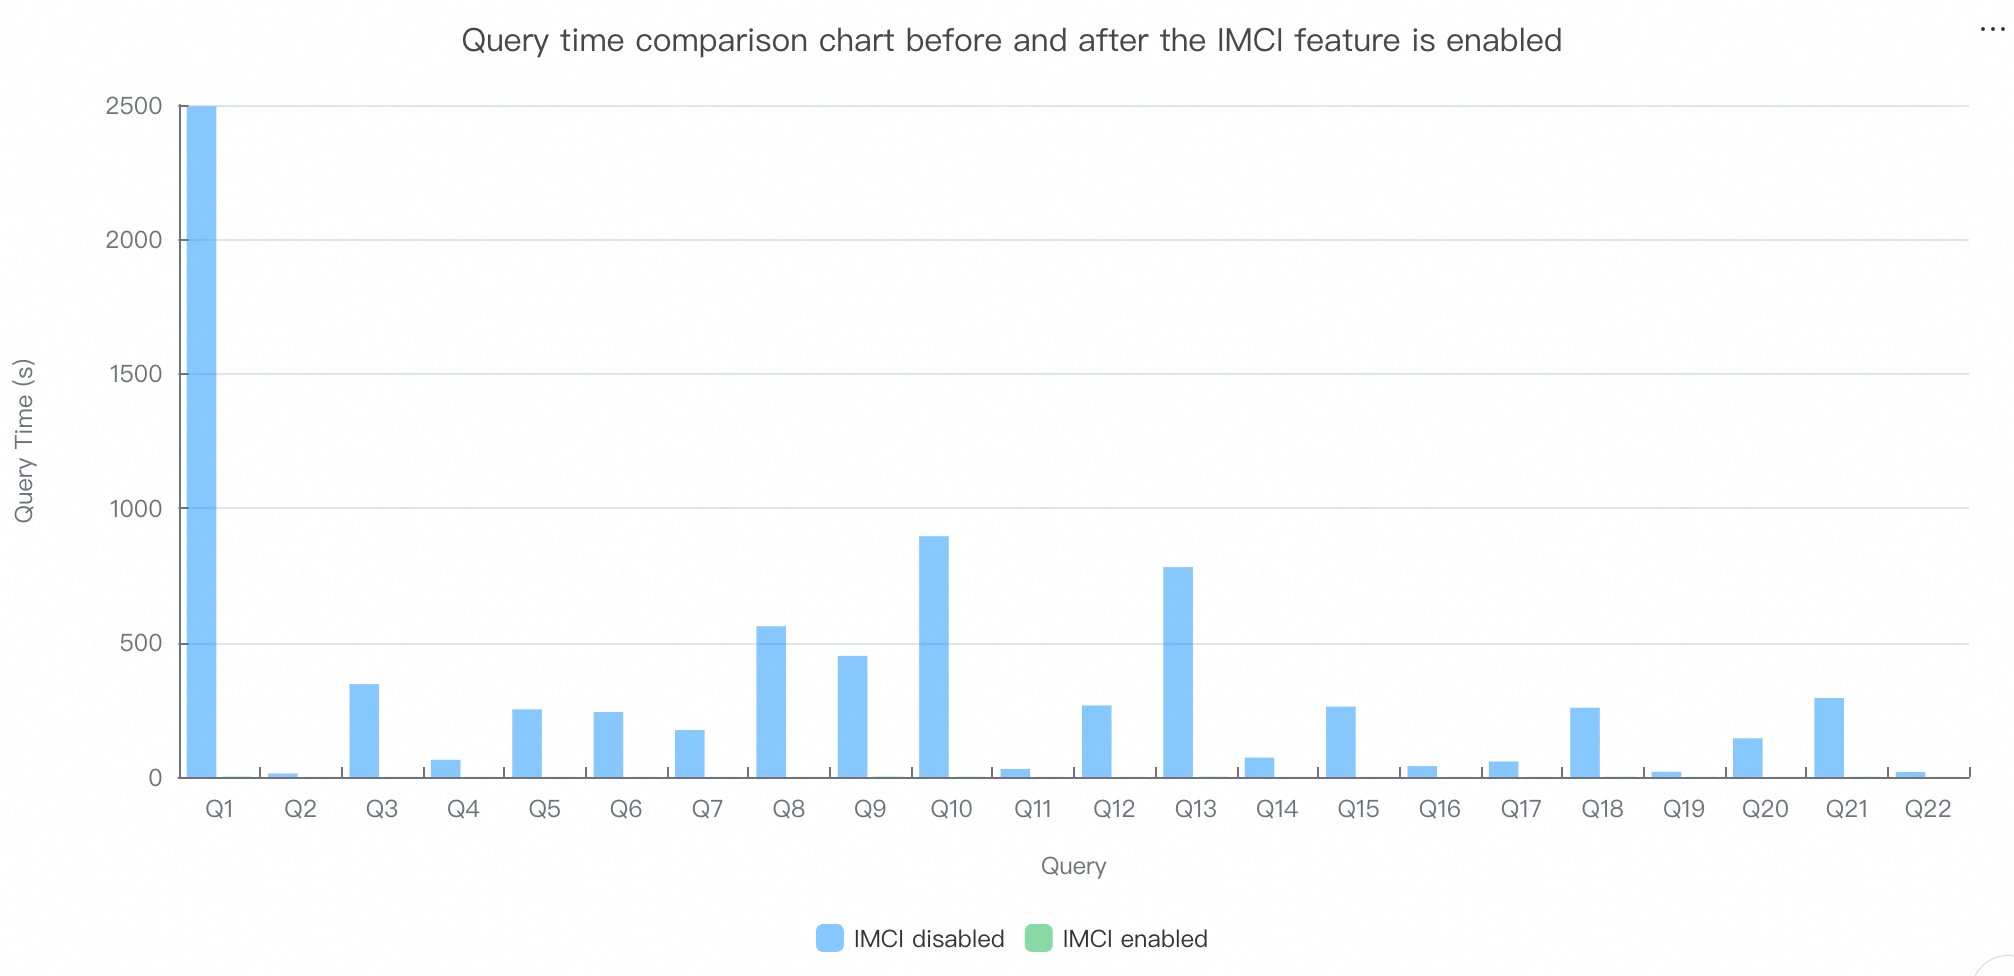
The following figure compares query times across multiple nodes after IMCI is enabled.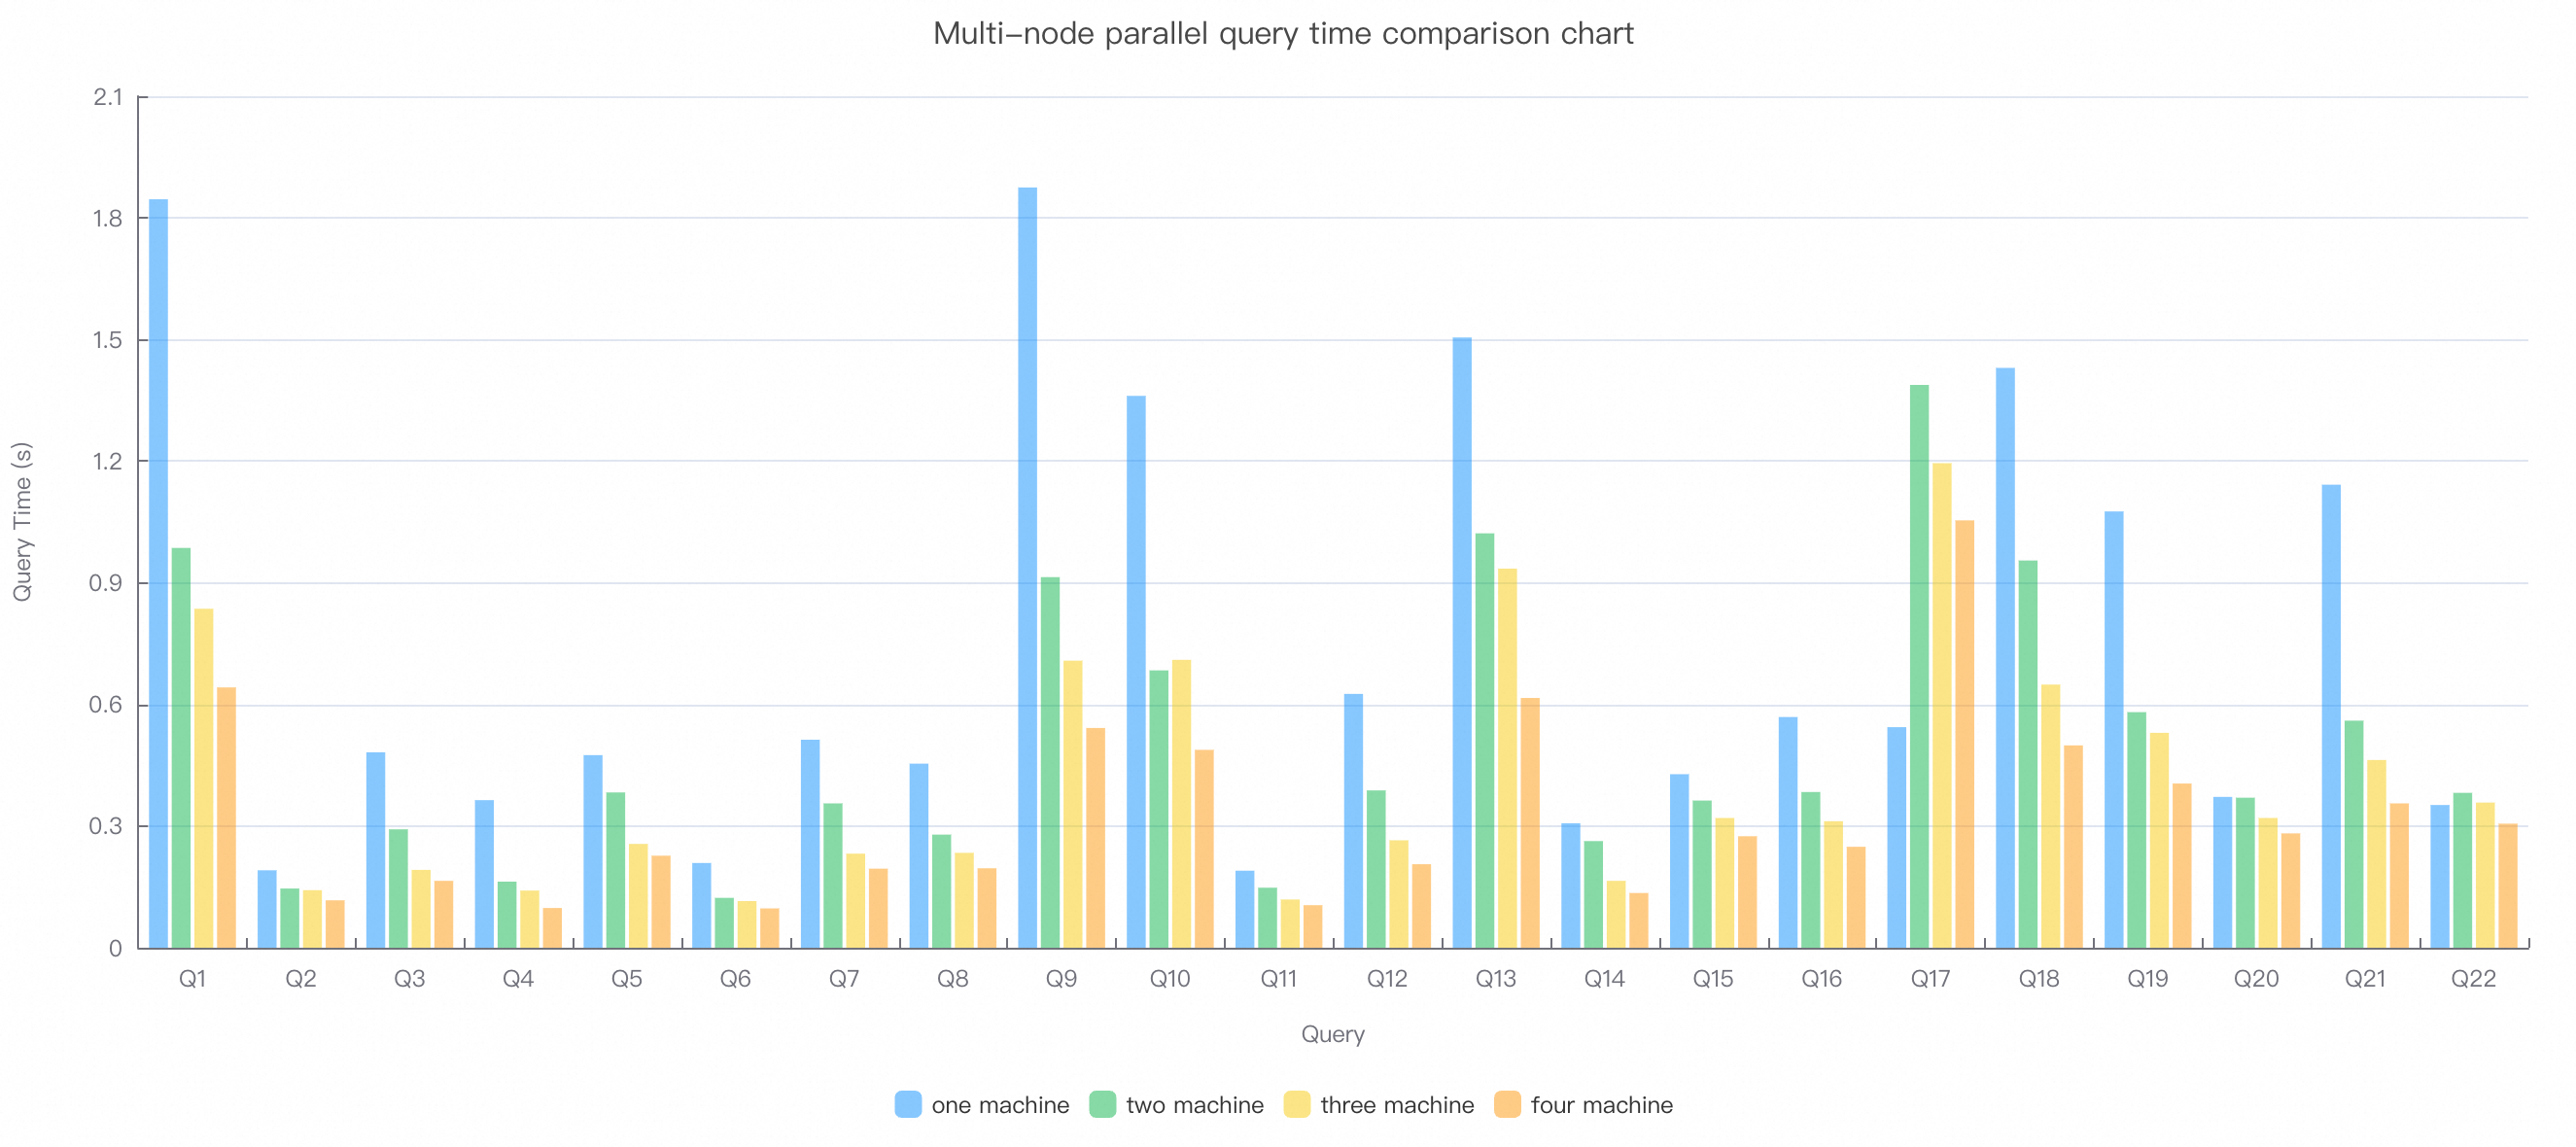
Test environment 2: 8-core 32 GB nodes
This test measures column store query performance with IMCI enabled on a 100 GB TPC-H dataset across four 8-core 32 GB nodes.
| SQL query | Query time (seconds) |
|---|---|
| Q1 | 3.014 |
| Q2 | 0.239 |
| Q3 | 0.605 |
| Q4 | 0.316 |
| Q5 | 0.636 |
| Q6 | 0.326 |
| Q7 | 0.66 |
| Q8 | 0.596 |
| Q9 | 2.464 |
| Q10 | 1.715 |
| Q11 | 0.257 |
| Q12 | 0.895 |
| Q13 | 2.516 |
| Q14 | 0.39 |
| Q15 | 0.736 |
| Q16 | 0.69 |
| Q17 | 2.689 |
| Q18 | 3.395 |
| Q19 | 1.521 |
| Q20 | 0.811 |
| Q21 | 1.335 |
| Q22 | 0.747 |
| Total | 26.553 |
TPC-H 1 TB
Test environment 1: 32-core 256 GB nodes
This test measures column store query performance with IMCI enabled on a 1 TB TPC-H dataset. It shows how query time changes as you scale from one to four 32-core 256 GB nodes.
The times shown are not from the first run.
| SQL query | 1 node (seconds) | 2 nodes (seconds) | 3 nodes (seconds) | 4 nodes (seconds) | Multi-node scale factor |
|---|---|---|---|---|---|
| Q1 | 37.887 | 25.495 | 8.189 | 6.061 | 1.56 |
| Q2 | 1.357 | 0.725 | 0.567 | 0.416 | 0.82 |
| Q3 | 20.379 | 11.478 | 1.784 | 2.653 | 1.92 |
| Q4 | 13.766 | 1.542 | 1.38 | 0.741 | 4.64 |
| Q5 | 19.317 | 4.003 | 2.268 | 1.69 | 2.86 |
| Q6 | 13.496 | 6.372 | 2.359 | 0.591 | 5.71 |
| Q7 | 23.388 | 10.523 | 2.068 | 1.595 | 3.67 |
| Q8 | 21.443 | 10.82 | 1.593 | 1.143 | 4.69 |
| Q9 | 53.665 | 28.061 | 10.761 | 18.661 | 0.72 |
| Q10 | 34.708 | 11.243 | 10.054 | 4.728 | 1.84 |
| Q11 | 1.543 | 0.866 | 0.795 | 0.628 | 0.61 |
| Q12 | 26.284 | 13.178 | 7.595 | 1.829 | 3.59 |
| Q13 | 25.986 | 12.942 | 10.848 | 6.639 | 0.98 |
| Q14 | 16.745 | 8.641 | 3.023 | 1.028 | 4.07 |
| Q15 | 28.147 | 3.201 | 2.286 | 1.853 | 3.80 |
| Q16 | 5.703 | 3.788 | 2.253 | 1.767 | 0.81 |
| Q17 | 22.433 | 14.715 | 11.651 | 10.131 | 0.55 |
| Q18 | 89.751 | 41.766 | 25.612 | 18.365 | 1.22 |
| Q19 | 36.414 | 20.41 | 11.557 | 8.752 | 1.04 |
| Q20 | 16.353 | 3.44 | 2.739 | 2.429 | 1.68 |
| Q21 | 43.945 | 6.768 | 4.82 | 3.299 | 3.33 |
| Q22 | 3.475 | 3.775 | 3.141 | 2.637 | 0.33 |
| Total | 556.185 | 243.752 | 127.343 | 97.636 | 1.42 |
The following figure compares query times across node configurations.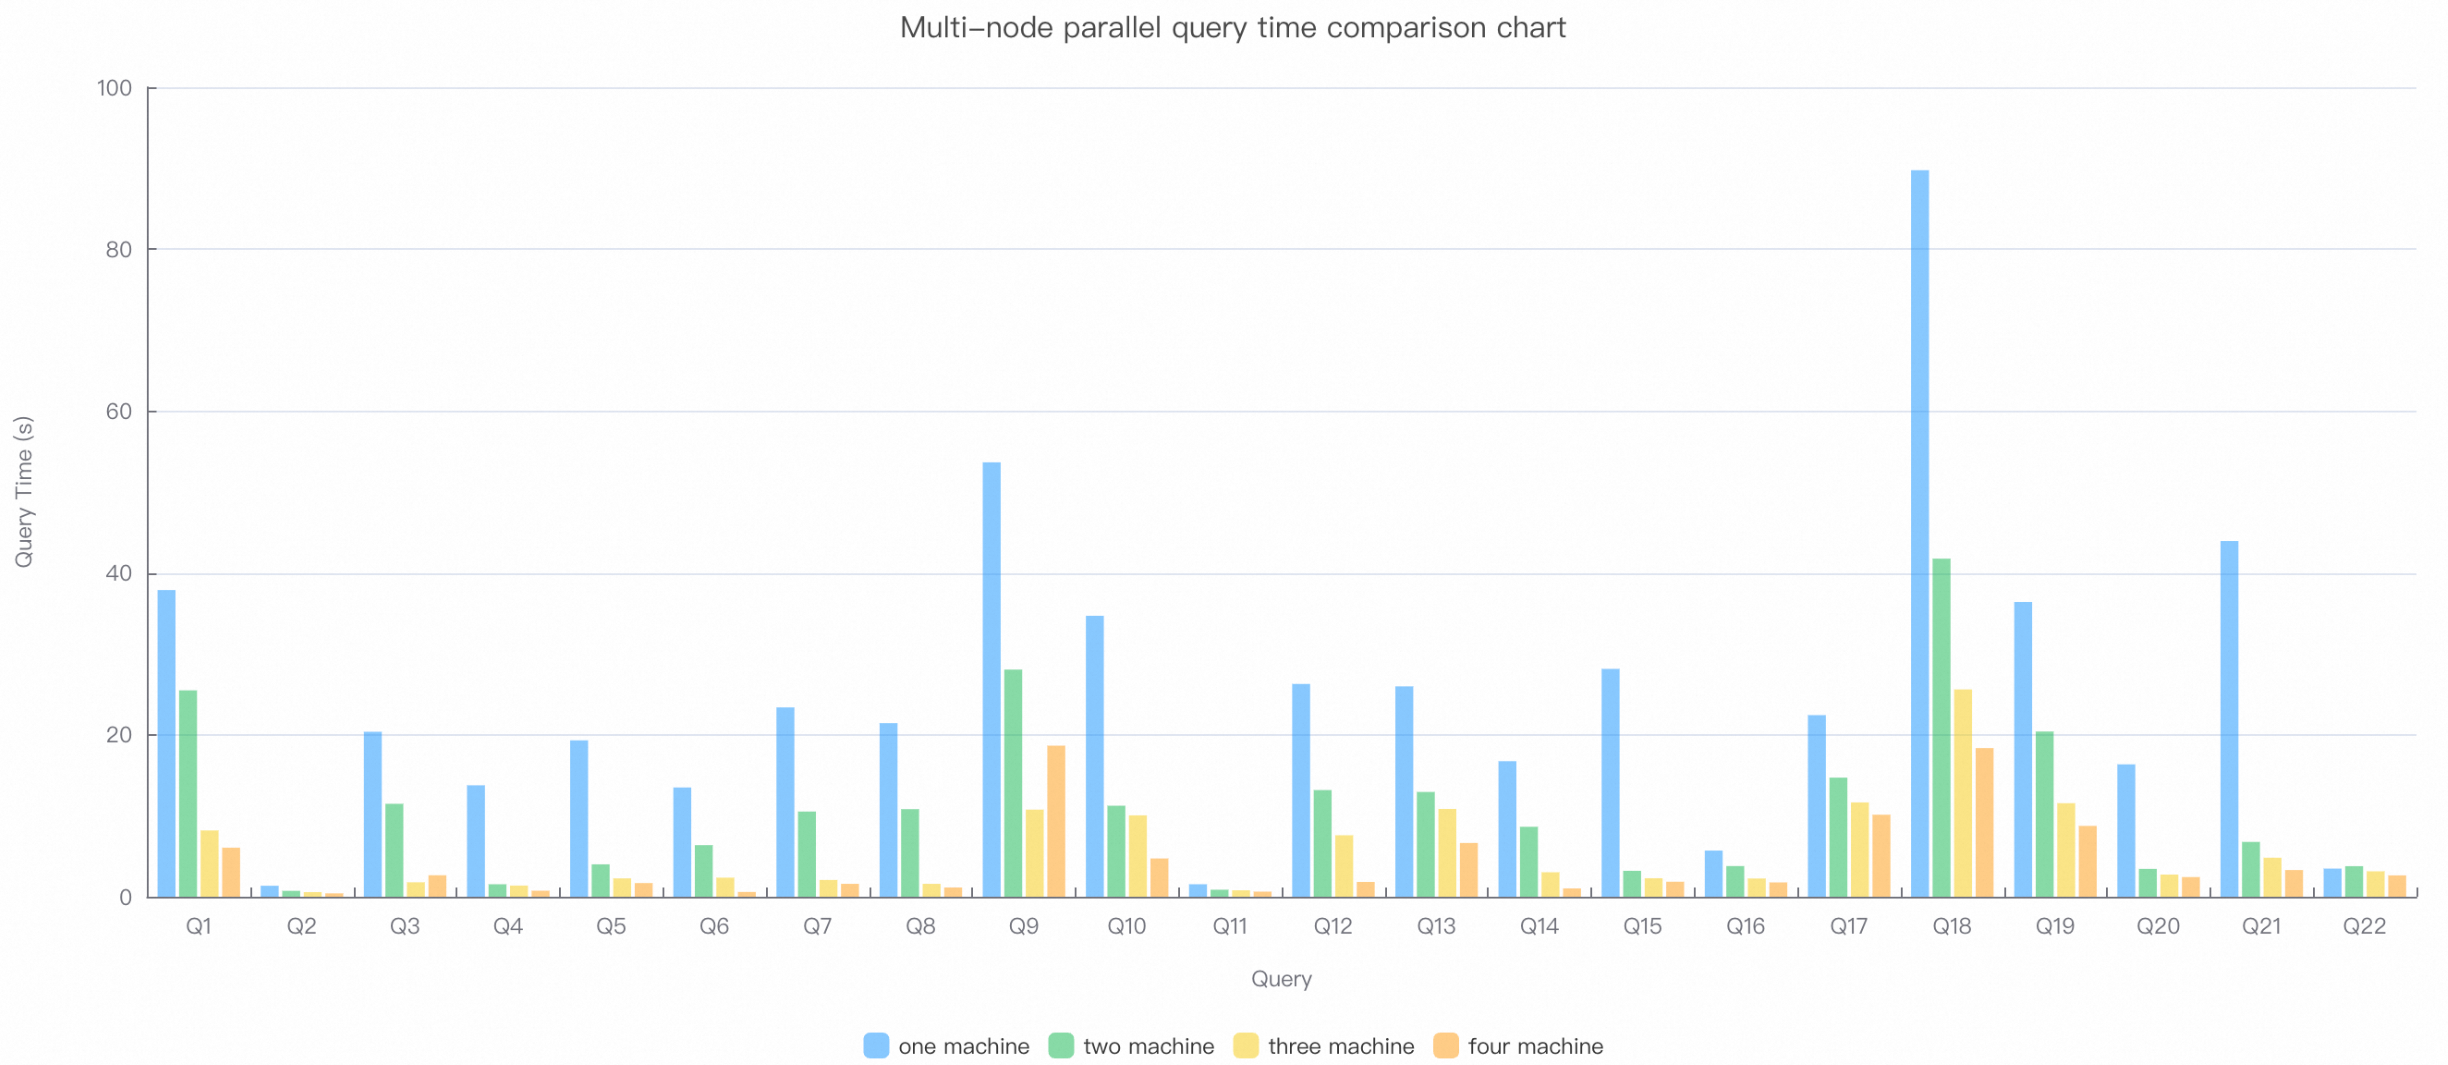
Test environment 2: 8-core 32 GB nodes
This test measures column store query performance with IMCI enabled on a 1 TB TPC-H dataset across four 8-core 32 GB nodes.
| SQL query | Query time (seconds) |
|---|---|
| Q1 | 55.545 |
| Q2 | 1.386 |
| Q3 | 31.712 |
| Q4 | 16.113 |
| Q5 | 30.062 |
| Q6 | 23.215 |
| Q7 | 30.432 |
| Q8 | 32.907 |
| Q9 | 104.637 |
| Q10 | 44.04 |
| Q11 | 2.139 |
| Q12 | 28.469 |
| Q13 | 35.825 |
| Q14 | 21.549 |
| Q15 | 42.483 |
| Q16 | 7.906 |
| Q17 | 52.072 |
| Q18 | 64.924 |
| Q19 | 48.368 |
| Q20 | 26.958 |
| Q21 | 55.754 |
| Q22 | 8.436 |
| Total | 764.932 |
TPC-H 3 TB
Test environment: 32-core 256 GB nodes
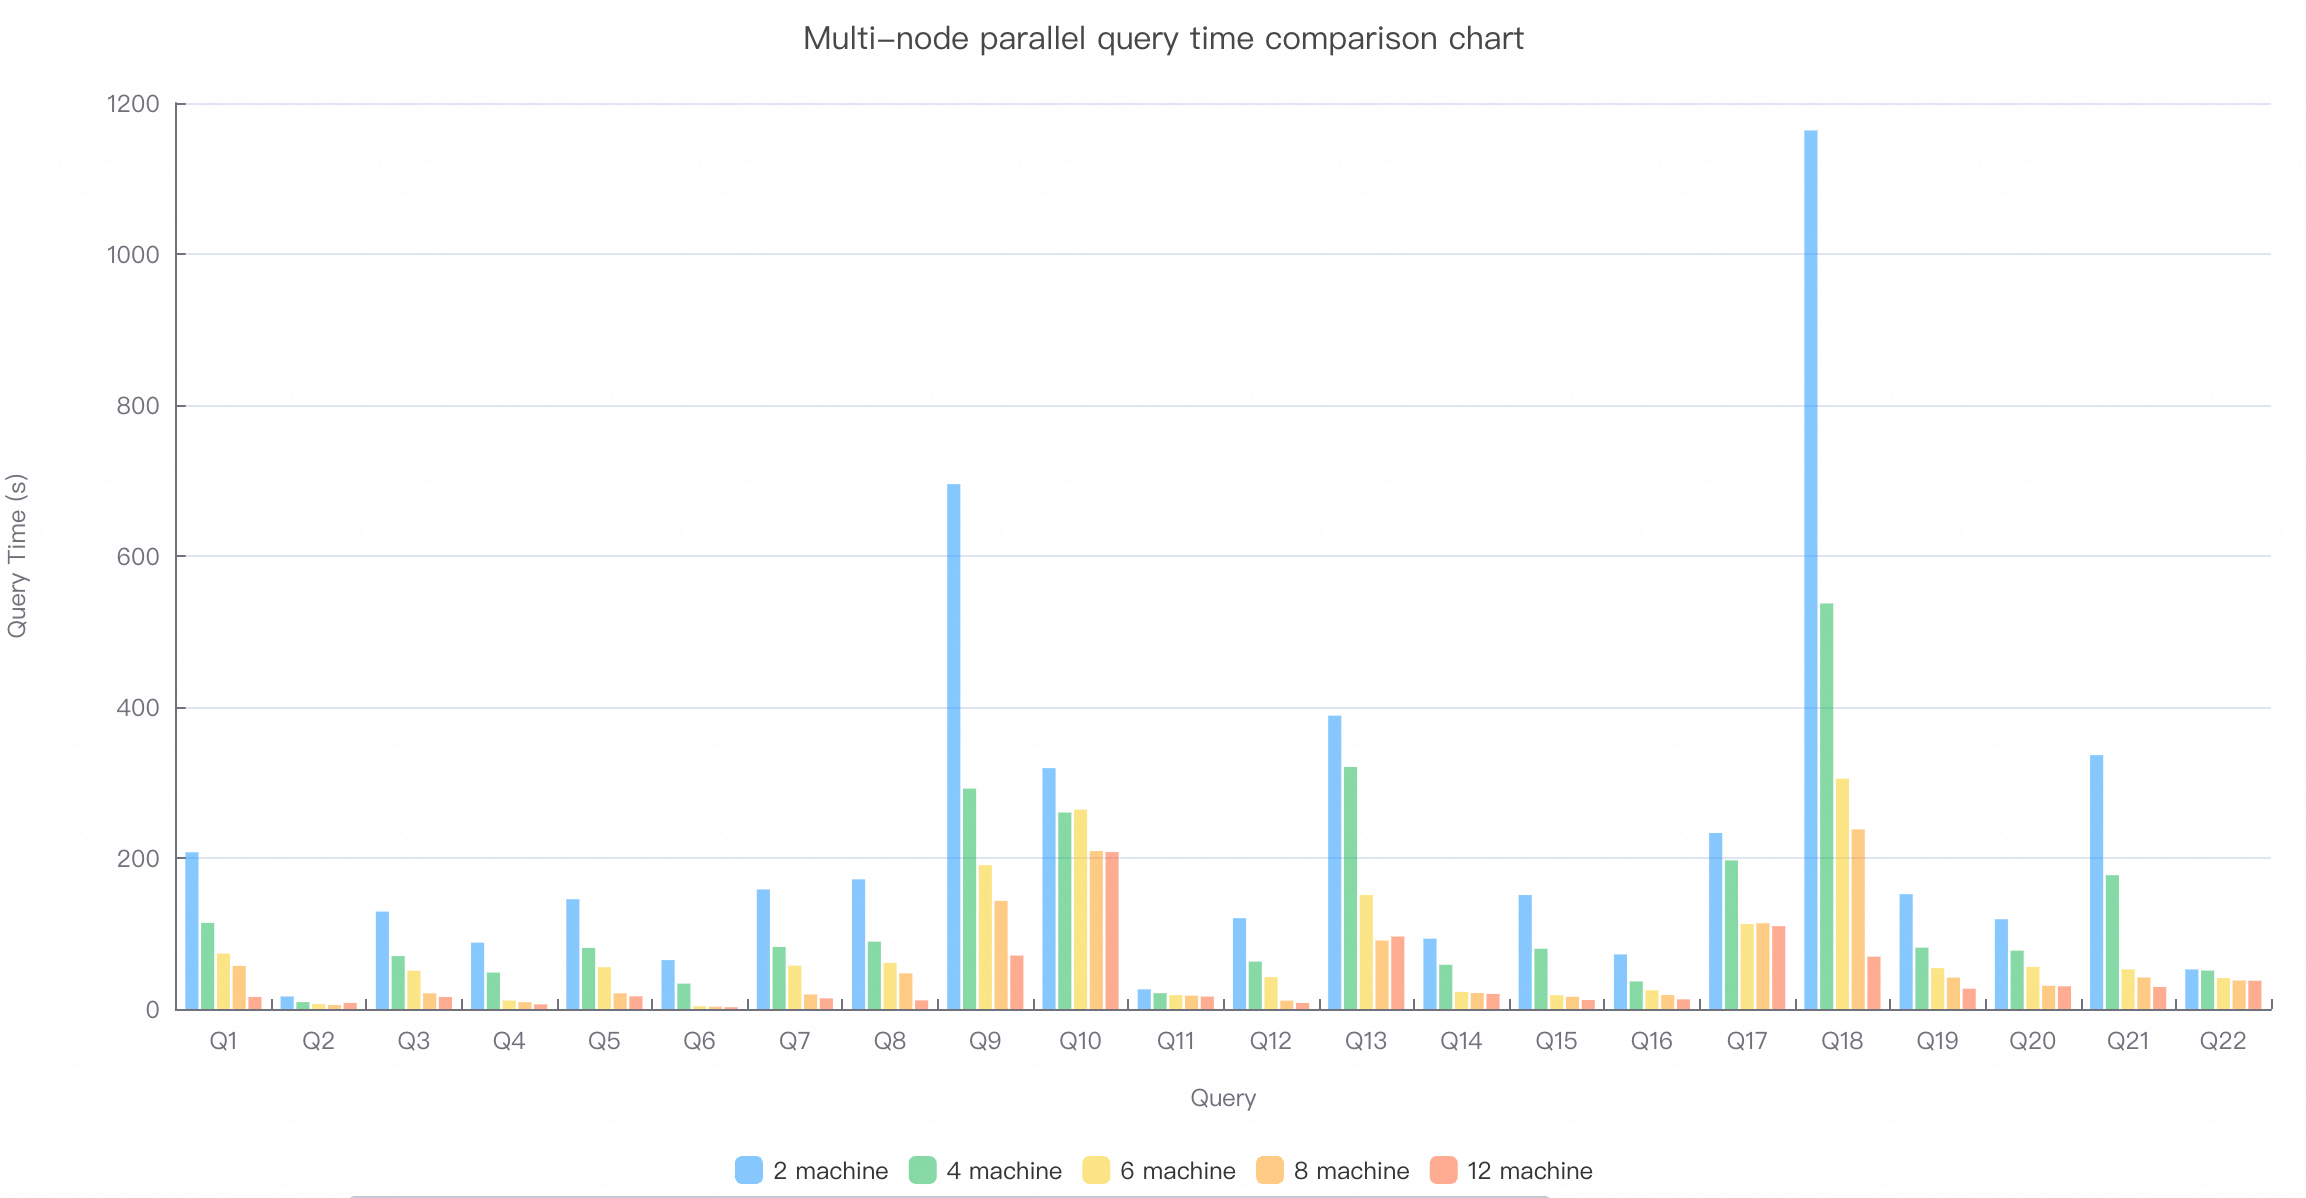
This test measures column store query performance with IMCI enabled on a 3 TB TPC-H dataset. It shows how query time scales as you add nodes, from two up to twelve 32-core 256 GB nodes.
| SQL query | 2 nodes (seconds) | 4 nodes (seconds) | 6 nodes (seconds) | 8 nodes (seconds) | 12 nodes (seconds) |
|---|---|---|---|---|---|
| Q1 | 207.5972 | 114.1061 | 73.47038 | 57.16459 | 15.99434 |
| Q2 | 16.59763 | 9.126449 | 6.531764 | 5.256679 | 8.056107 |
| Q3 | 129.0127 | 70.05587 | 50.75962 | 20.77513 | 15.96027 |
| Q4 | 87.88678 | 48.23547 | 11.22043 | 9.06577 | 6.153393 |
| Q5 | 145.3669 | 80.90937 | 55.35411 | 20.8387 | 16.81331 |
| Q6 | 64.77278 | 33.61284 | 3.626543 | 3.1164 | 2.393298 |
| Q7 | 158.332 | 82.21748 | 57.402 | 19.28089 | 14.15242 |
| Q8 | 171.7152 | 89.18184 | 61.07931 | 47.21762 | 11.49657 |
| Q9 | 695.1544 | 291.9174 | 190.4007 | 143.2241 | 70.81171 |
| Q10 | 318.9998 | 260.2054 | 263.955 | 209.1835 | 207.9049 |
| Q11 | 26.04949 | 20.9185 | 18.32898 | 17.69759 | 16.45135 |
| Q12 | 120.3137 | 62.77258 | 42.20166 | 11.08824 | 7.982793 |
| Q13 | 388.5152 | 320.5632 | 151.0701 | 90.68545 | 96.00401 |
| Q14 | 93.1189 | 58.5961 | 22.68045 | 21.14225 | 19.99422 |
| Q15 | 150.9475 | 79.81816 | 18.32744 | 16.26336 | 11.92104 |
| Q16 | 72.26089 | 36.46251 | 24.70481 | 18.45767 | 12.8234 |
| Q17 | 233.1315 | 196.8246 | 112.588 | 113.5308 | 109.7312 |
| Q18 | 1163.623 | 537.1255 | 305.1325 | 237.8622 | 69.33614 |
| Q19 | 152.0749 | 81.25671 | 54.06552 | 41.54125 | 26.91918 |
| Q20 | 118.8899 | 77.28576 | 55.68256 | 30.76349 | 30.0725 |
| Q21 | 336.2304 | 177.2311 | 52.50164 | 41.73258 | 29.24006 |
| Q22 | 52.38819 | 50.87576 | 40.99282 | 37.71081 | 37.43663 |
| Total | 4902.97928 | 2779.29879 | 1672.07638 | 1213.59912 | 837.648829 |
The following figure compares query times across node configurations.