The SQL Explorer feature of PolarDB for MySQL has been upgraded to SQL Explorer and Audit. This service is provided by Database Autonomy Service (DAS). The Search (Audit) feature collects the details of all SQL statements. This lets you query and export SQL statements and their related information, such as the database, user, or client IP address that executed the SQL statement. The SQL Explorer feature diagnoses SQL statement health, troubleshoots performance issues, and analyzes service traffic. This improves the efficiency of fault diagnosis, database optimization, and threat detection.
Features
Database Autonomy Service (DAS) integrates features such as search, SQL Explorer, security audit, and traffic playback and stress testing using full request collection and security auditing. This helps you retrieve specific information about SQL statements, troubleshoot performance issues, identify the sources of important threats, and verify whether you need to scale out your cluster to handle service traffic peaks.
Search: Query and export SQL statements and their corresponding information, such as the database, status, and running time. For more information, see Audit.
SQL Explorer: Helps you diagnose SQL statement health, troubleshoot performance issues, and analyze service traffic. For more information, see SQL Explorer.
SQL Review: Provides global SQL payload analysis to help you quickly locate and analyze suspicious SQL statements in your database instances and obtain optimization suggestions. For more information, see SQL Review.
Traffic Playback and Stress Testing: Provides traffic playback and stress testing capabilities to help you validate whether you need to scale out your instance specifications to handle service traffic peaks. For more information, see Traffic Playback and Stress Testing.
Security Audit: Automatically detects threats such as important SQL, SQL injection, and new access sources. For more information, see Security audit.
Transaction Analysis: Allows you to retrieve the transaction types, number of transactions, and transaction details for a thread within a specified time period. This helps you understand, analyze, and optimize database performance at the transaction level. For more information, see Transaction Analysis.
Quick Transaction Analysis: Lets you find the start and end statements of a transaction that contains a specific SQL statement. This helps you determine whether the transaction was committed or rolled back. For more information, see Quick transaction analysis.
Supported regions
You can use the SQL Explorer and Audit feature only after you enable DAS Enterprise Edition. The supported regions vary by Enterprise Edition version. For more information, see Databases and regions supported by each edition.
Impact
The SQL Explorer feature records the information about all executed DQL, DML, and DDL statements. DAS obtains the information from database kernels, which consumes only a small amount of CPU resources.
Notes
If you are a RAM user, you must grant the AliyunPolardbReadOnlyWithSQLLogArchiveAccess permission to the RAM user to use the Search feature. For more information about how to grant permissions to a RAM user, see Create and manage RAM users.
You can also use a custom policy to grant a RAM user permissions to use the Search feature, including the export feature. For more information, see Use a custom policy to authorize a RAM user to use the Search feature of SQL Explorer and Audit.
Costs
Enterprise Edition V0
The SQL Explorer feature supports only the pay-as-you-go billing method. The subscription billing method is not supported. The fees for this feature are billed as part of the cloud-native database PolarDB service.
Price
Regions in the Chinese mainland: USD 0.0013/GB/hour.
Hong Kong (China) and other regions outside China: USD 0.0019/GB/hour.
Enterprise Edition V1 and later
Fees for the SQL Explorer feature are billed as part of DAS. For more information, see Product billing of Database Autonomy Service (DAS).
Enable SQL Explorer and Audit
Log on to the PolarDB console. In the navigation pane on the left, click Clusters. Select the region where your cluster is located, and then click the cluster ID to go to the cluster details page.
In the navigation pane on the left, choose .
Click Enable SQL Explorer.
NoteIf DAS Enterprise Edition is not enabled for your Alibaba Cloud account, follow the on-screen instructions to enable it.
On the page that appears, click a tab to view the related information.
Search (Audit): Query and export SQL statements and their corresponding information, such as the database, status, and running time.
SQL Explorer:
Display by Time Range: Select a time range to view the SQL Explorer results. You can view the Execution Duration Distribution, Execution Duration, and Executions of all SQL statements within the selected time range. You can also view detailed information about all SQL statements in the Full Request Statistics area and export the information to your computer.
NoteYou can export a maximum of 1,000 SQL logs. To retrieve logs from a wider time range or in a larger quantity, use the Search (Audit) feature.
After you enable SQL Explorer and wait for 30 minutes, you can view the Audit logs.
Display by Comparison: Select the time points to compare SQL Explorer results. You can view the comparison results of all SQL statements for Execution Duration Distribution, Execution Duration, and Executions. You can also view detailed comparison results in the Requests by Comparison area.
Source Statistics: Select a time range for SQL source statistics to view the source information of all SQL statements within the selected time range.
SQL Review: Analyzes the workload of database clusters for a selected time range and a baseline time range. It performs an in-depth analysis of the SQL statements that run on the database clusters and provides index optimization suggestions, SQL rewrite suggestions, Top SQL, New SQL, Failed SQL, SQL feature analysis, SQL with execution plan changes, SQL with performance degradation, and top traffic tables.
Related SQL Identification: Select a metric to view and click the Analysis button. After 1 to 5 minutes, you can identify the SQL statements and their details that most closely match the change trends of the selected metric within the specified time range.
Traffic Playback and Stress Testing: If you are facing an upcoming short-term business peak or database schema evolution (especially index changes), you can use this feature to confirm whether the database cluster specifications need to be scaled out. This helps validate the actual performance in real-world business scenarios and reduces the risk of failures after the service is published.
Security Audit: Automatically detects threats such as high-risk operations, SQL injection, and new access sources.
Transaction Analysis: Analyzes the transaction details for the selected thread and time range based on hot storage data from DAS Enterprise Edition V3. It performs statistical analysis and plots a trend chart of the number of different types of transactions.
Parameter description
Execution Duration Distribution: On the Execution Duration Distribution tab, you can view the distribution of execution durations of SQL queries based on the time range that you specify. The statistical data is collected every minute. The execution durations are divided into seven ranges:
[0,1] ms: indicates that the execution duration ranges from 0 ms to 1 ms. The chart shows the percentage of SQL queries whose execution durations fall within this range.(1,2] ms: indicates that the execution duration is greater than 1 ms and less than or equal to 2 ms. The chart shows the percentage of SQL queries whose execution durations fall within this range.(2,3] ms: indicates that the execution duration is greater than 2 ms and less than or equal to 3 ms. The chart shows the percentage of SQL queries whose execution durations fall within this range.(3,10] ms: indicates that the execution duration is greater than 3 ms and less than or equal to 10 ms. The chart shows the percentage of SQL queries whose execution durations fall within this range.(10,100] ms: indicates that the execution duration is greater than 10 ms and less than or equal to 100 ms. The chart shows the percentage of SQL queries whose execution durations fall within this range.(0.1,1]s: indicates that the execution duration is greater than 0.1s and less than or equal to 1s. The chart shows the percentage of SQL queries whose execution durations fall within this range.> 1s: indicates that the execution duration is greater than 1s. The chart shows the percentage of SQL queries whose execution durations fall within this range.
NoteThe section on the Execution Duration Distribution tab shows the execution time of SQL statements on the instance over time. The larger the blue area of the chart is, the healthier the instance is when the SQL statements are executed on the instance. The larger the orange and red areas of the chart are, the less healthy the instance is when the SQL statements are executed on the instance.
Execution Duration: On the Execution Duration tab, you can specify a time range to view the execution durations of SQL queries.
Full Request Statistics: You can view the details of SQL statements based on the time range that you specify. The details include the SQL text, execution duration percentage, average execution duration, and execution trend for each SQL statement.
NoteYou can calculate the execution duration percentage for the SQL statements that use a specific SQL template based on the following formula: Execution duration percentage = (Execution duration of the SQL statements that use the SQL template × Number of executions of the SQL statements)/(Total execution duration of all SQL statements × Total number of executions) × 100%. Higher execution duration percentages indicate that the database instance uses a larger number of MySQL resources to execute the corresponding SQL statements.
SQL ID: You can click an SQL ID to view the performance trend and sample data of the SQL statements that use the corresponding SQL template.
SQL Sample: On the SQL Sample tab, you can view the client that initiated each sample SQL request.
NoteThe UTF-8 character set is used to encode SQL samples.
Modify the storage duration of SQL logs
If you reduce the storage duration for SQL Explorer and Audit data, DAS immediately deletes the SQL audit logs that exceed the new storage duration. Export and save the SQL audit logs to your computer before you reduce the storage duration.
Log on to the PolarDB console. In the navigation pane on the left, click Clusters. Select the region where your cluster is located, and then click the cluster ID to go to the cluster details page.
In the navigation pane on the left, choose .
In the upper-right corner, click Service Settings.
Modify the storage duration and click OK.
NoteIf you have enabled DAS Enterprise Edition V3, you can modify the data storage duration for different sub-features.
The storage space for SQL Explorer and Audit data is provided by DAS and does not occupy the storage space of your database cluster.
Disable SQL Explorer and Audit
When you disable the SQL Explorer and Audit feature, the SQL audit logs are deleted. Export and save the SQL audit logs to your computer before you disable the feature. When you re-enable the feature, SQL audit logs are recorded starting from the time of re-enabling.
Log on to the PolarDB console. In the navigation pane on the left, click Clusters. Select the region where your cluster is located, and then click the cluster ID to go to the cluster details page.
In the navigation pane on the left, choose .
Click Service Settings to disable SQL Explorer and Audit.
If you have enabled DAS Enterprise Edition V3, you can check all the features of SQL Explorer and Audit.
NoteIf you enabled the audit log collection feature for PolarDB for MySQL using the CloudLens for PolarDB feature in Simple Log Service, the SQL Explorer feature is automatically enabled for that PolarDB for MySQL cluster. Therefore, you must also disable the audit log collection feature for that PolarDB for MySQL cluster. For more information, see Enable data ingestion.
After the SQL Explorer feature is disabled, the SQL audit logs are deleted. We recommend that you export the SQL records before you disable the feature. For information about how to export SQL records, see Export SQL log records.
Click OK.
View the size and consumption details of audit logs
Log on to the Alibaba Cloud Management Console. In the upper-right corner of the page, choose Expenses.
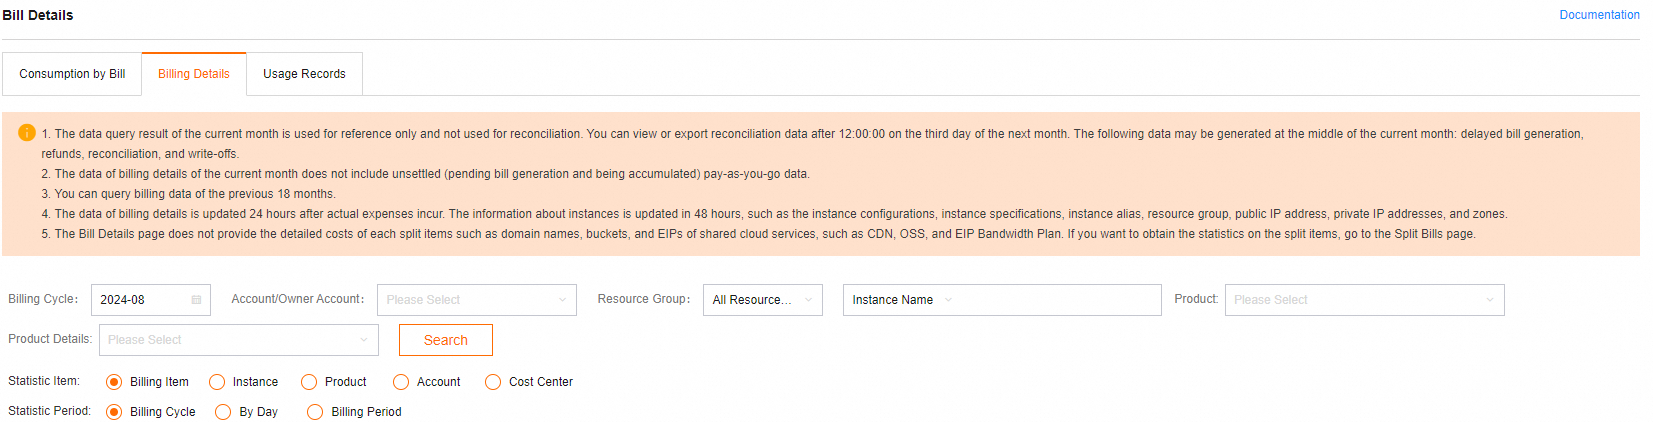
In the left-side Expenses and Costs navigation pane, choose . View the expense details where the Billing Item column is set to sql_explorer.
On the Billing Details tab, click the Details tab, and then search by Instance ID.View the expense details where the Billing Item column is set to sql_explorer.
Migrate to the new version
Currently, only database clusters in the China (Hangzhou), China (Shanghai), China (Beijing), and China (Shenzhen) regions support migrating from an earlier version of SQL Explorer and Audit to the new version.
Log on to the PolarDB console. In the navigation pane on the left, click Clusters. Select the region where your cluster is located, and then click the cluster ID to go to the cluster details page.
In the navigation pane on the left, click Logs and Auditing > SQL Explorer.
In the Upgrade SQL Explorer to "SQL Explorer and Audit" dialog box that appears, click One-click Upgrade.
Migrate SQL Explorer and Audit data between different Enterprise Edition versions
Enterprise Edition V2 changes the underlying storage architecture from Enterprise Edition V1 and uses hybrid storage of hot and cold data to reduce costs. Enterprise Edition V3 is built on this hybrid storage and provides more flexible billing based on the features you use, which further reduces costs.
If your database cluster supports Enterprise Edition V3, you can migrate data from DAS Enterprise Edition V1 or V2 to Enterprise Edition V3 to benefit from lower costs. For more information, see How do I migrate data between different DAS Enterprise Edition versions?
FAQ
Can I use a resource plan to offset the costs of SQL Explorer?
No. SQL Explorer is a pay-as-you-go feature. It does not support the subscription billing method or resource plans.
What is the
logout!statement in the Full Request Statistics section of SQL Explorer?logout!indicates that a connection is disconnected. The duration of alogout!statement is the time difference between the last interaction and the occurrence of thelogout!event. You can consider this the idle duration of the connection. 1158 in the Status column indicates that the network connection was disconnected. Possible reasons include the following:The client connection timed out.
The server-side connection was abnormally disconnected.
The server-side connection was reset because the interactive_timeout or wait_timeout duration was exceeded.
Why does the % access source appear in the source statistics of SQL Explorer?
This may occur when you use a stored procedure. The following example shows how this can happen:
NoteIn the following example, the database cluster is a PolarDB for MySQL cluster, the test account is test_user, and the test database is test_db.
Create a standard-permission account and grant it permissions on a database in the PolarDB console. For more information, see Create a standard-permission account.
Use the test account to connect to the database cluster from the command line. For more information, see Connect to a cluster from the command line.
Switch to the test database and create the following stored procedure.
-- Switch to the test database
USE test_db;
-- Create a stored procedure DELIMITER $$ DROP PROCEDURE IF EXISTS `das` $$ CREATE DEFINER=`test_user`@`%` PROCEDURE `das`() BEGIN SELECT * FROM information_schema.processlist WHERE Id = CONNECTION_ID(); END $$ DELIMITER ;Connect to the database cluster using a privileged account. For more information, see Create a privileged account and Connect to a cluster using the command line.
Call the stored procedure.
-- Switch to the test database
USE test_db;
-- Call the stored procedure CALL das();-- Call result +-----------+-----------+---------+---------+---------+------+-----------+-------------------------------------------------------------------------+ | ID | USER | HOST | DB | COMMAND | TIME | STATE | INFO | +-----------+-----------+---------+---------+---------+------+-----------+-------------------------------------------------------------------------+ | 269660316 | test_user | %:46182 | test_db | Query | 0 | executing | SELECT * FROM information_schema.processlist WHERE Id = CONNECTION_ID() | +-----------+-----------+---------+---------+---------+------+-----------+-------------------------------------------------------------------------+
Why is the database name displayed in the audit log list inconsistent with the one in the SQL statement?
The database name in the log list is retrieved from the session. The database name in the SQL statement is specified by the user and depends on the query design, such as in cross-database queries or dynamic SQL scenarios. Therefore, the two may be inconsistent.
Does enabling SQL Explorer and Audit affect database performance? If so, what is the impact?
Yes, but the impact is minimal and almost imperceptible.
The specific resource consumption is as follows:
CPU and memory: Consumption is extremely low and can be ignored.
Storage space: This is mainly used to store audit information. However, the SQL Explorer and Audit feature of DAS Enterprise Edition uses storage space provided by DAS and does not occupy the storage space of your database cluster.
Network: It does not affect network performance.
Disk performance: It does not affect disk performance because audit data is stored on the DAS side, not on the disks of the database cluster.
I executed an
UPDATEstatement in the cluster. The audit log shows that the number of affected rows is 1. However, the data in the table was not updated and remains in its previous state. How can I troubleshoot and resolve this issue?Troubleshooting procedure:
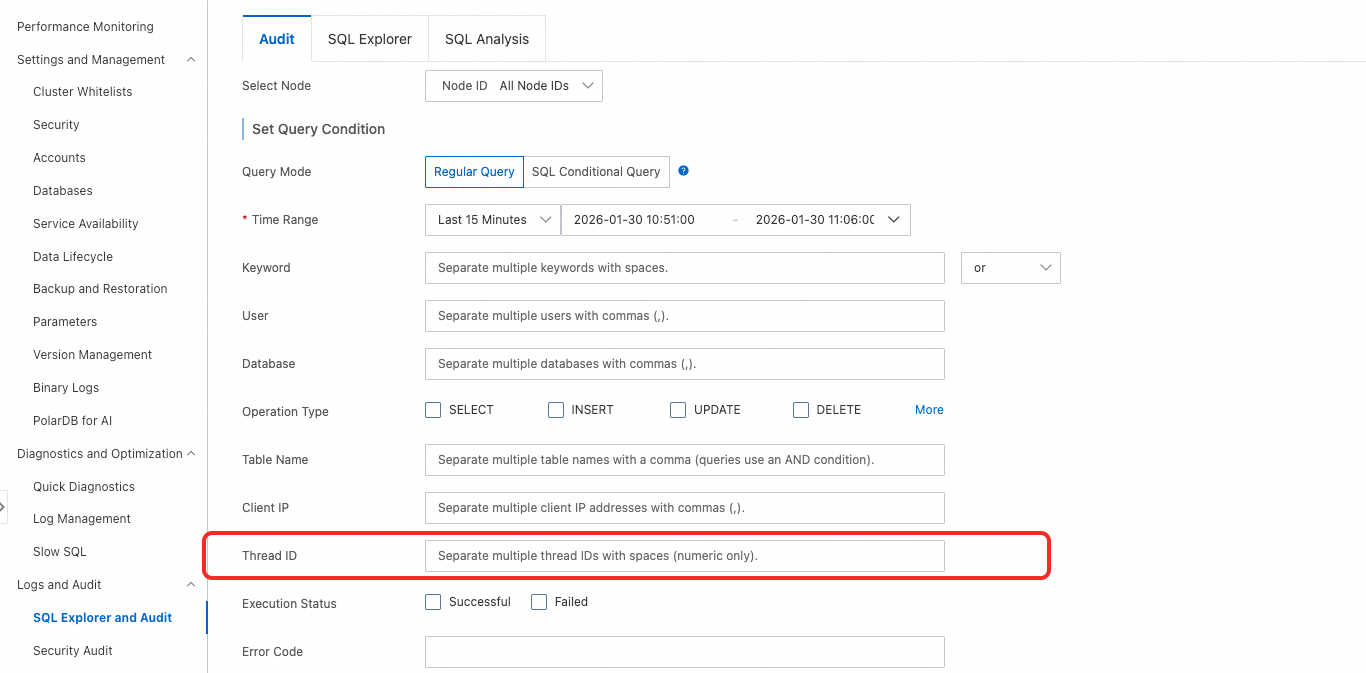
Find the SQL statement in the audit log and retrieve the Thread ID. Then, click Enable Advanced Search and search by Thread ID. Check whether
AUTOCOMMITis disabled for the current thread. If it is, check for an explicitCOMMIT.NoteWe recommend that you perform a filtered search only by Thread ID. If too many logs are returned, combine other conditions as needed to reduce the number of logs for easier analysis.
If this method does not locate the issue, consider recovering the database and table and parsing the logs to confirm whether there is a record of a successful modification.
NoteThis troubleshooting procedure assumes the
UPDATEstatement is the final step of the business logic. Because the data remains unchanged after this modification, no further checks for subsequent modifications or deletions are needed. If a subsequent modification does occur, you must continue to check for related SQL operations that caused the data to change.Problem scenario:
AUTOCOMMIT is disabled and the SQL statement is not committed: The troubleshooting procedure shows that
AUTOCOMMITwas disabled during the execution of this request, and no explicitCOMMITwas performed afterward. This caused the data to remain unchanged, as shown in the screenshot.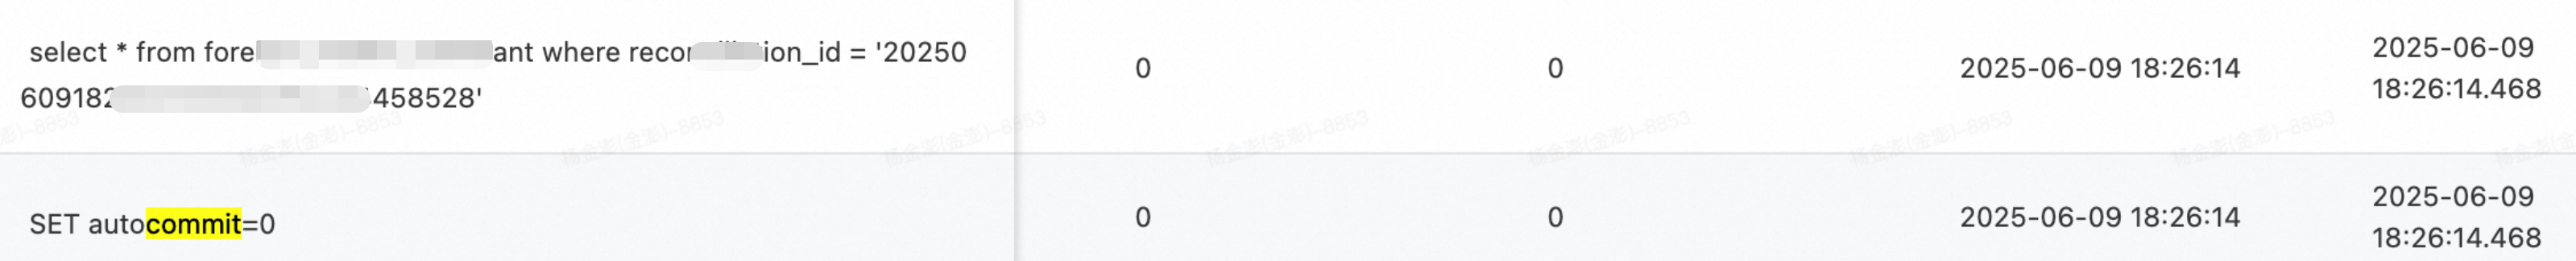
Transaction
ROLLBACK: All operations in a transaction must either succeed or fail together. If a rollback occurs, all operations are reverted. Follow the troubleshooting process to check if aROLLBACKoperation was executed after the request.